Fig. A.1.
Download original image
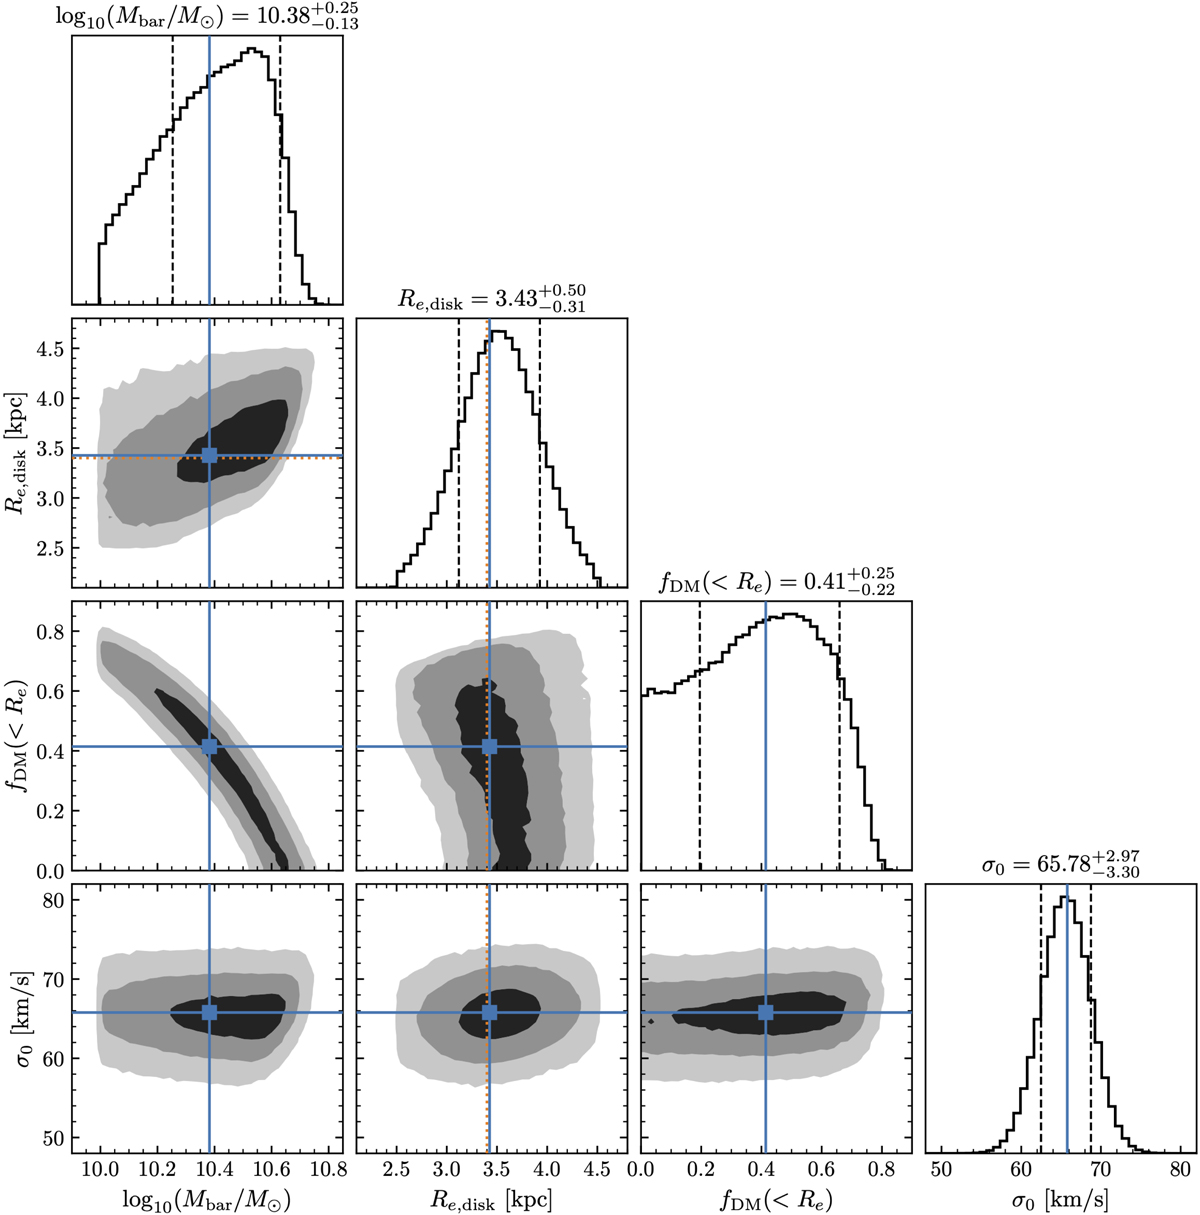
MCMC “corner plot” for the kinematic modeling of HZ4. Figure shows the 1D and 2D projections of the posterior probability distributions of the four free parameters: the total baryonic mass (Mbar), the effective radius (Re), the dark-matter fraction within one effective radius (fDM(≤Re)), and the intrinsic velocity dispersion (σ0). For Gaussian priors, the centers are marked with orange lines. The maximum a posteriori values of each parameter (found by jointly analyzing the posteriors of all parameters; the “best-fit” values) are shown with blue squares and lines. For the 2D histograms, the contours correspond to the 1, 2, and 3σ confidence intervals. For the 1D histograms, the uncertainties are the shortest interval enclosing or 1σ of the marginalized posterior distribution.
Current usage metrics show cumulative count of Article Views (full-text article views including HTML views, PDF and ePub downloads, according to the available data) and Abstracts Views on Vision4Press platform.
Data correspond to usage on the plateform after 2015. The current usage metrics is available 48-96 hours after online publication and is updated daily on week days.
Initial download of the metrics may take a while.