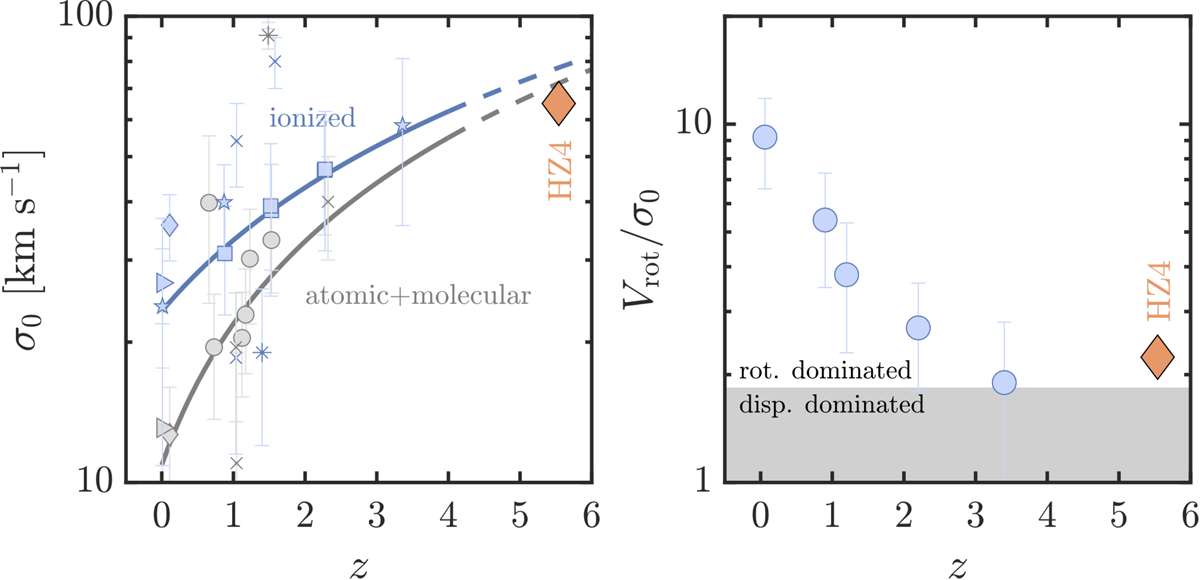
Fig. 2.
Download original image
Evolution of the intrinsic velocity dispersion (σ0; left) and the disk dynamical support (Vrot/σ0; right) as a function of redshift. HZ4 at z ≈ 5 is shown as an orange diamond. Left panel: circles show average values from different surveys of ionized (blue) and atomic and/or molecular gas (gray). These include the following: DYNAMO (diamonds; Fisher et al. 2019; Girard et al. 2021); HERACLES, THINGS, and EDGE (triangles; Leroy et al. 2008, 2009; Mogotsi et al. 2016; Bolatto et al. 2017); KMOS3D and SINS/zC-SINF (squares; Förster Schreiber et al. 2006, 2009; Wisnioski et al. 2015, 2019; Übler et al. 2019); PHIBSS (circles; Tacconi et al. 2013; Freundlich et al. 2019); and GHASP/KDS/KROSS (stars; Epinat et al. 2010; Stott et al. 2016; Turner et al. 2017; Johnson et al. 2018). We also added individual measurements from lensed systems (crosses) from Swinbank et al. (2011) and Girard et al. (2019), as well as unlensed systems (asterisks) from Molina et al. (2019) and Übler et al. (2018). The solid lines show the best-fit relations to the observations compiled by Übler et al. (2019) up to z ≈ 3.5. Right panel: the circles show the average values for Vrot/σ0 from the ionized gas measured and compiled by Wisnioski et al. (2015). The gray box shows the region below ![]() , where the contribution to the dynamical support of the disk by random motions starts to dominate (e.g., Förster Schreiber & Wuyts 2020).
, where the contribution to the dynamical support of the disk by random motions starts to dominate (e.g., Förster Schreiber & Wuyts 2020).
Current usage metrics show cumulative count of Article Views (full-text article views including HTML views, PDF and ePub downloads, according to the available data) and Abstracts Views on Vision4Press platform.
Data correspond to usage on the plateform after 2015. The current usage metrics is available 48-96 hours after online publication and is updated daily on week days.
Initial download of the metrics may take a while.