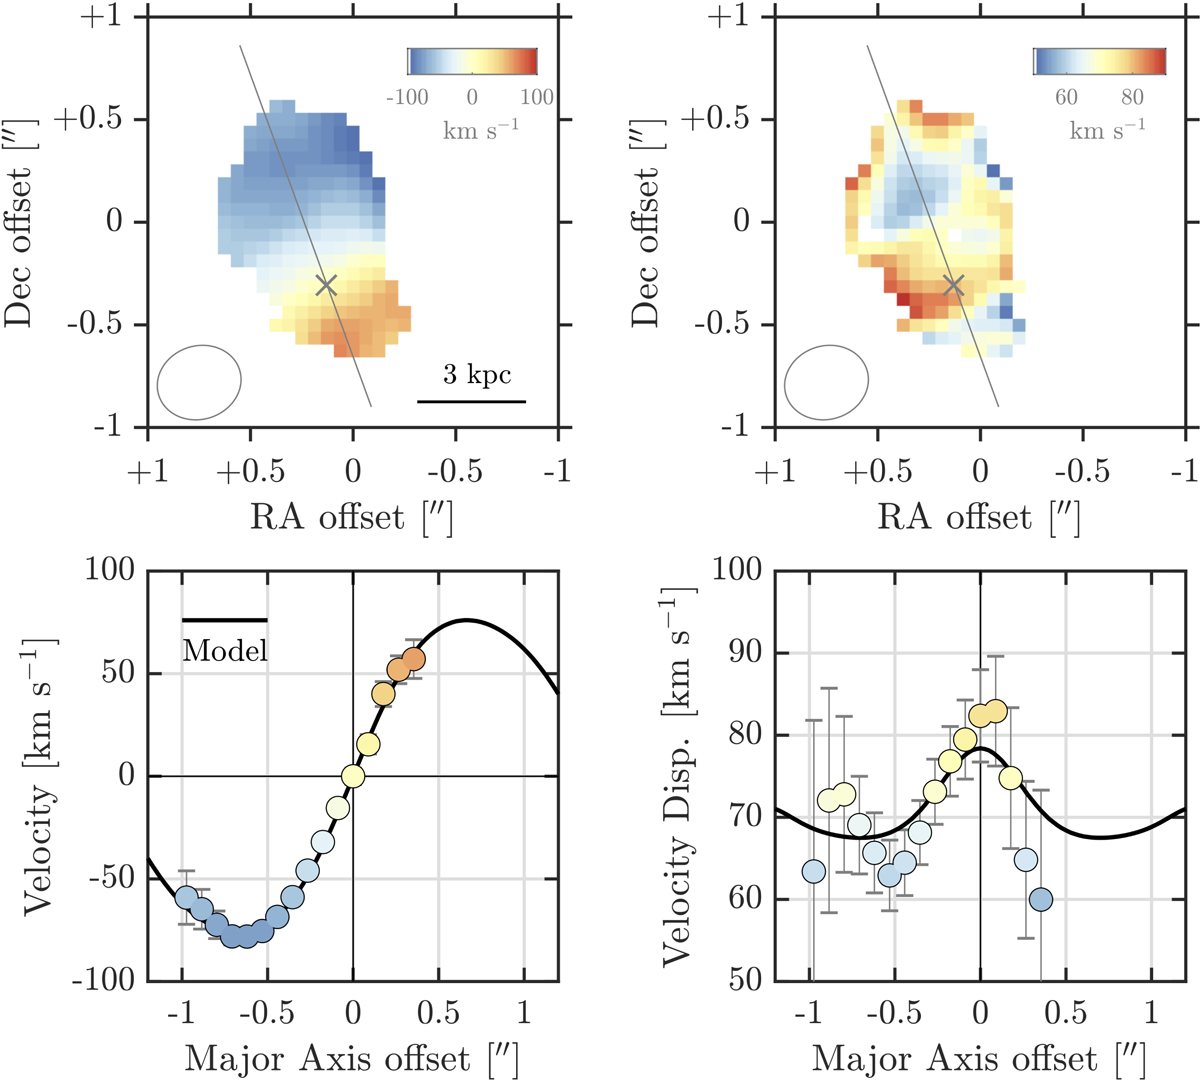
Fig. 1.
Download original image
Kinematic structure of HZ4 as traced by the [C II] line emission. Top: [C II] velocity field (left) and velocity dispersion map (right) of HZ4. The ALMA synthesized beam (θ = 0.39″ × 0.34″) is shown in the bottom-left corner. Bottom: rotation curve and velocity dispersion profiles extracted employing a pseudo-slit oriented along the kinematic major axis shown by the gray solid line in the upper panels, where the kinematic center is shown with a gray cross. The solid black line in both panels represents the best-fit DYSMAL model beam-convolved to the observed space.
Current usage metrics show cumulative count of Article Views (full-text article views including HTML views, PDF and ePub downloads, according to the available data) and Abstracts Views on Vision4Press platform.
Data correspond to usage on the plateform after 2015. The current usage metrics is available 48-96 hours after online publication and is updated daily on week days.
Initial download of the metrics may take a while.