Fig. 6
Download original image
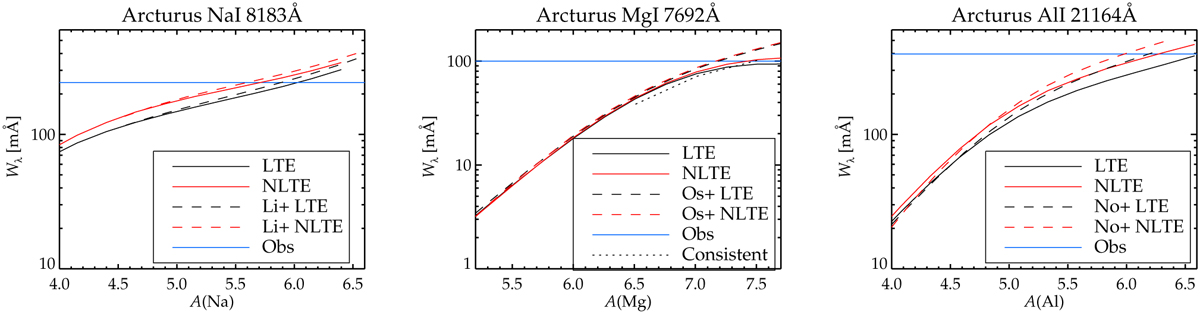
Examples of LTE (black) and NLTE (red) curves of growth for spectral lines of three different elements in Arcturus. Solid lines represent the results of this work and dashed lines correspond to the results of Lind et al. (2011) for Na, Osorio & Barklem (2016) for Mg, and Nordlander & Lind (2017) for Al. The black dotted line in the middle panel has been computed with model atmospheres that have consistent [α/Fe] ratios as explained in the text.
Current usage metrics show cumulative count of Article Views (full-text article views including HTML views, PDF and ePub downloads, according to the available data) and Abstracts Views on Vision4Press platform.
Data correspond to usage on the plateform after 2015. The current usage metrics is available 48-96 hours after online publication and is updated daily on week days.
Initial download of the metrics may take a while.