Open Access
Fig. 5
Download original image
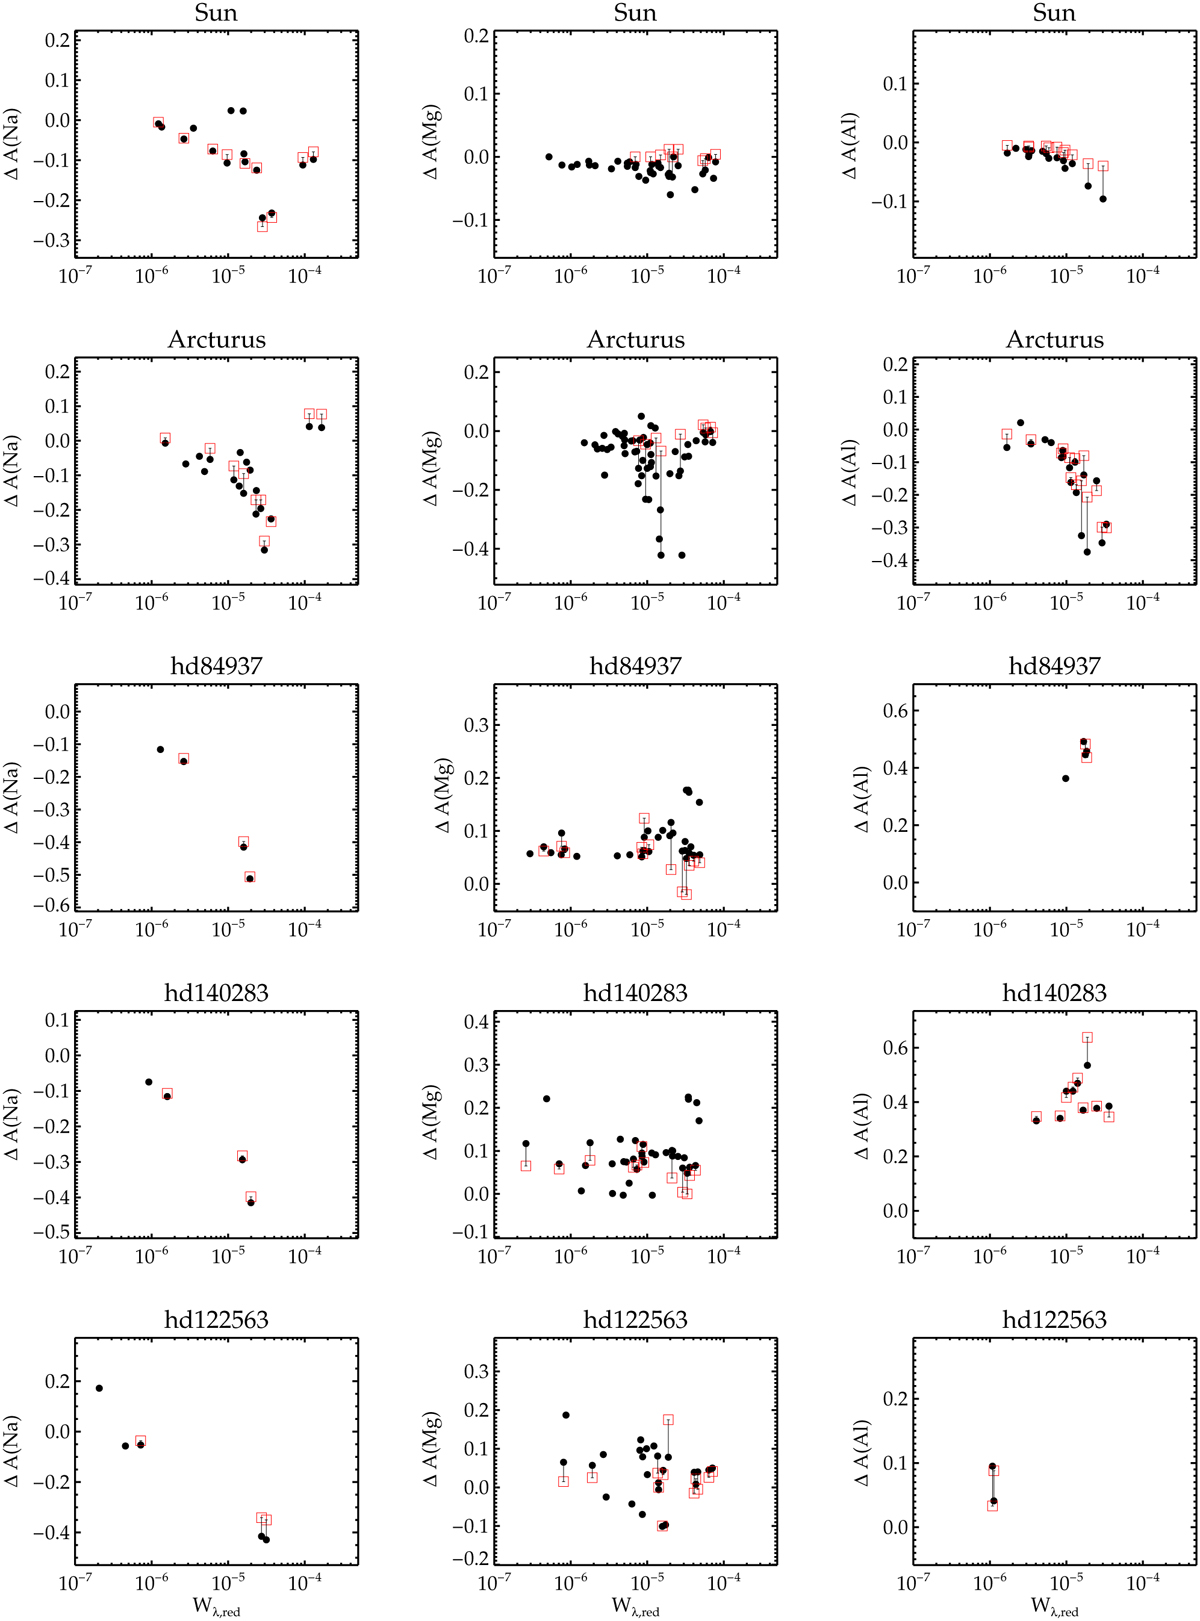
New NLTE corrections compared to previous work. Black bullets represent the results of this study and red open squares the results of Lind et al. (2011) for Na, Osorio & Barklem (2016) for Mg, and Nordlander & Lind (2017) for Al. Vertical lines connect lines in common between the studies.
Current usage metrics show cumulative count of Article Views (full-text article views including HTML views, PDF and ePub downloads, according to the available data) and Abstracts Views on Vision4Press platform.
Data correspond to usage on the plateform after 2015. The current usage metrics is available 48-96 hours after online publication and is updated daily on week days.
Initial download of the metrics may take a while.