Fig. 3
Download original image
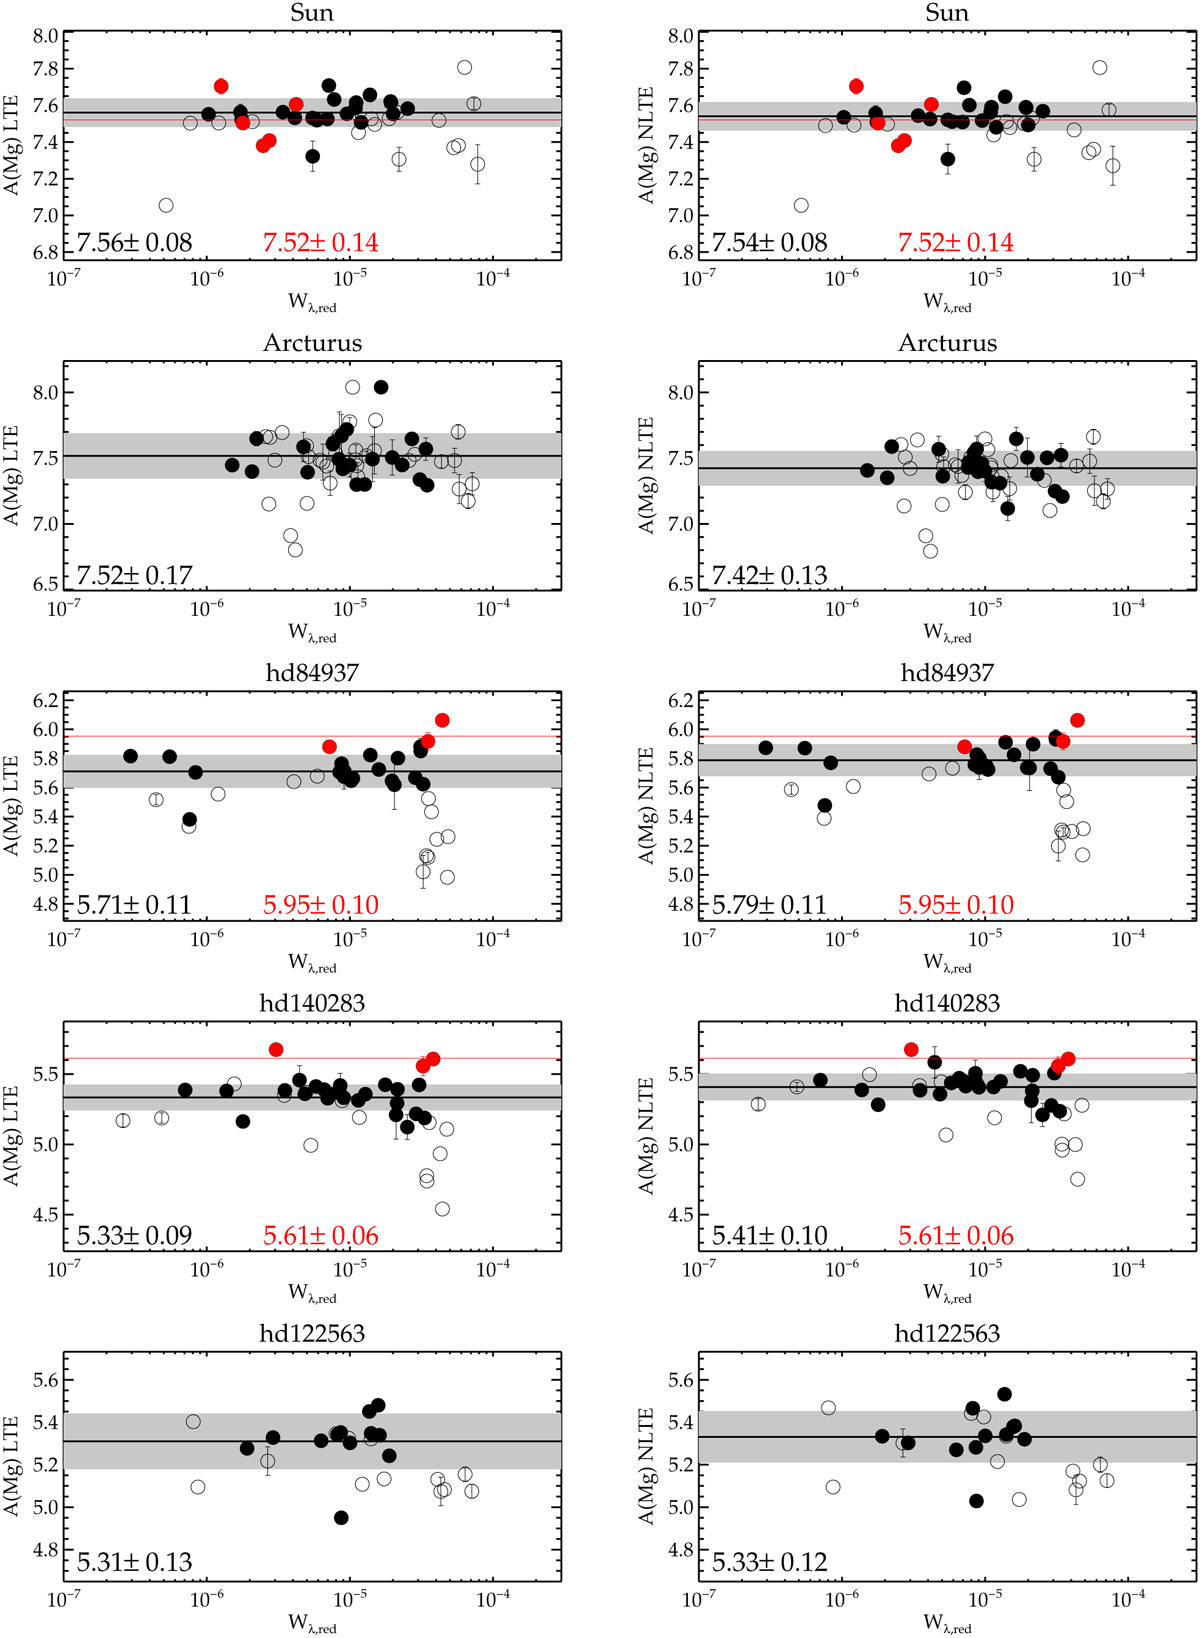
Mg abundances derived from neutral lines with Wλ,red < 3 × 10⁻⁵ and high-quality gf values (black bullets), from neutral lines with Wλ,red < 3 × 10⁻⁵ and/or low-quality gf-values (open bullets), and from singly ionised lines (red bullets) in LTE (left) and NLTE (right). The black horizontal lines and grey-shaded regions correspond to the mean and one sigma standard deviation of the lines marked with filled black bullets. The red horizontal lines correspond to the mean of the singly ionised lines.
Current usage metrics show cumulative count of Article Views (full-text article views including HTML views, PDF and ePub downloads, according to the available data) and Abstracts Views on Vision4Press platform.
Data correspond to usage on the plateform after 2015. The current usage metrics is available 48-96 hours after online publication and is updated daily on week days.
Initial download of the metrics may take a while.