Fig. 3
Download original image
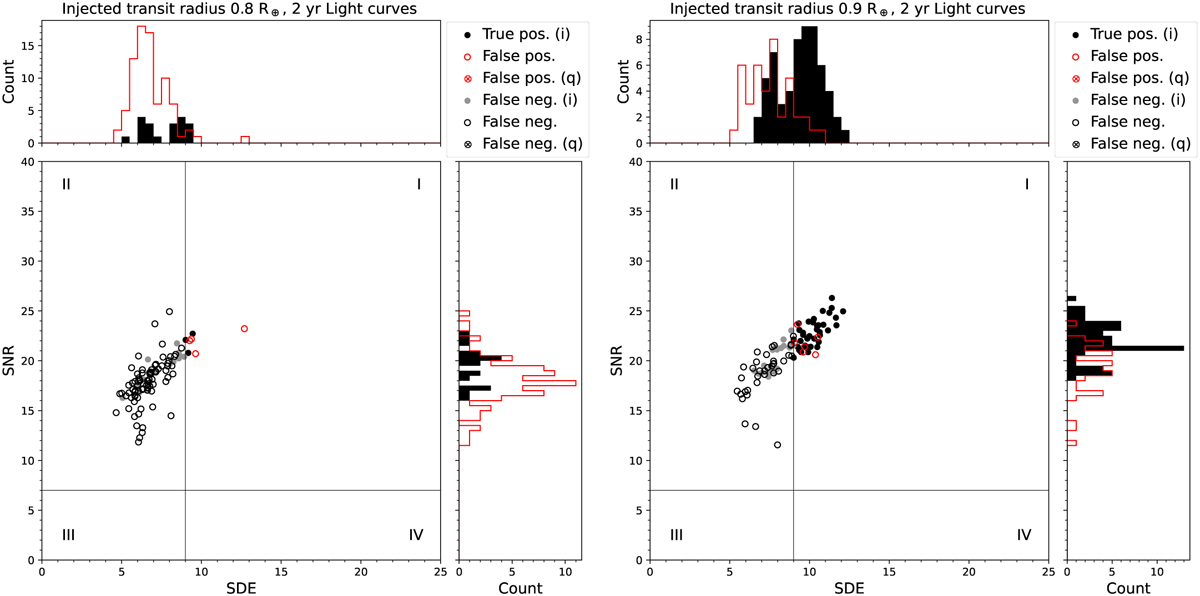
SDE vs. S/N distribution obtained with TLS for 100 simulated 2yr light curves from 24 PLATO cameras for bright (mV = 8) Sun-like stars. (a) Light curves containing two transits of an Rp = 0.8 R⊕ planet, (b) Light curves containing two transits of an Rp = 0.9 R⊕ planet. Black lines at SDE = 9 and S/N = 7 define our nominal detection threshold. Black dots in quadrant I are true positives. Red open circles in quadrant I are false positives that are not related to quarterly jumps in the light curves. Red crossed circles in quadrant I are related to false positives caused by quarter jumps (not present in this plot but in similar plots in Appendix A). Gray dots outside of quadrant I are recoveries of the injected transit sequence but with SDE < 9 or S/N < 7 or both, that is, false negatives. Black open circles outside of quadrant I are false negatives not related to the injected signals. Black crossed circles outside of quadrant I are false negatives related to quarter jumps. The “(i)” in the legend refers to the injected signal, and “(q)” refers to quarter jumps. In the histograms, solid black bars count the number of injected signals recovered in the respective SDE or S/N bins, whereas red line bars count the number of false detections (both positives and negatives).
Current usage metrics show cumulative count of Article Views (full-text article views including HTML views, PDF and ePub downloads, according to the available data) and Abstracts Views on Vision4Press platform.
Data correspond to usage on the plateform after 2015. The current usage metrics is available 48-96 hours after online publication and is updated daily on week days.
Initial download of the metrics may take a while.