Fig. 2
Download original image
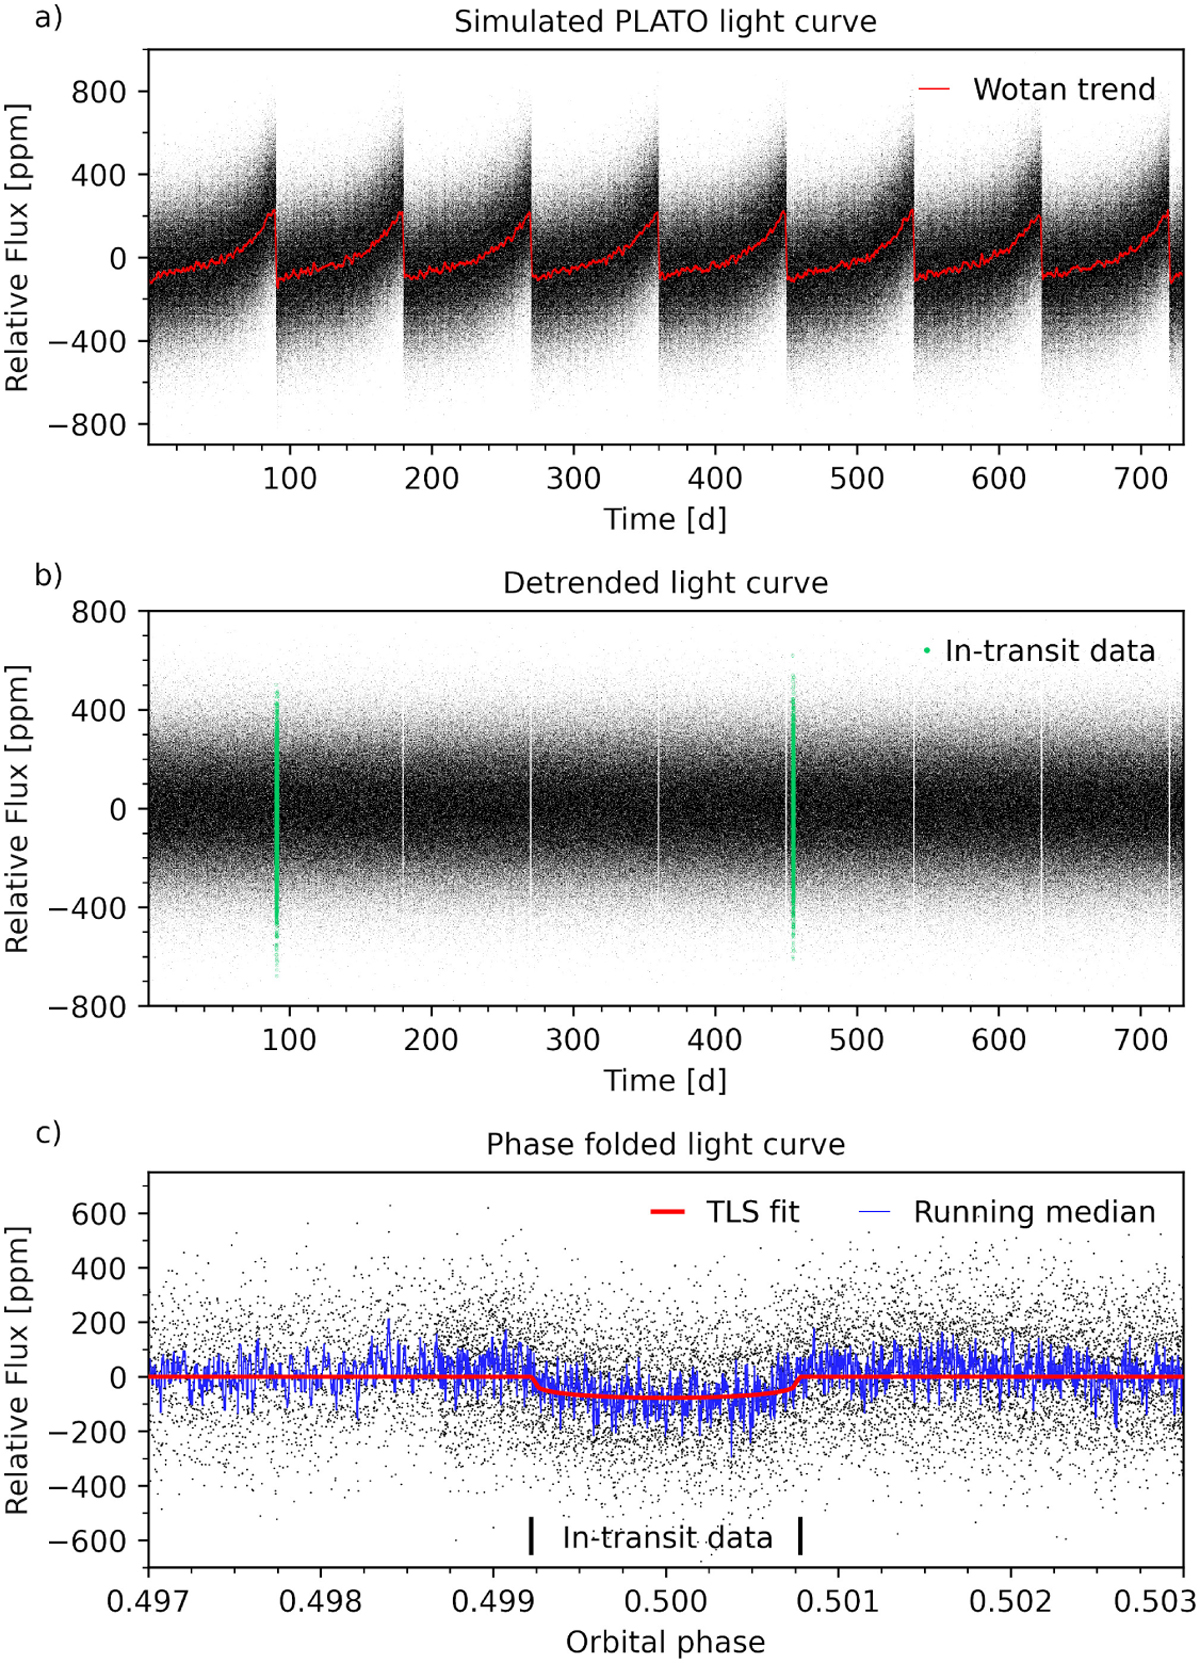
Illustration of our transit injection and retrieval experiment. Simulations include two transits of an Earth-sized planet with an orbital period of 364 d in a 2yr light curve of an mV = 9 Sun-like star. (a) PLATO-like light curve generated with PSLS. The red line shows the trend computed with Wōtan. (b) Light curve after detrending with Wōtan. The simulated transits occur at about 91 d and 455 d (highlighted with green points), that is, near quarterly reorientations of the spacecraft. This example was deliberately chosen to illustrate that Woōtan and TLS can master non-well-behaved systems. (c) Phase-folded light curve of the transit detected with TLS. The best model fit is shown with a red line. The 21-bin walking median (ten data points symmetrically around each data point) is shown with a blue line.
Current usage metrics show cumulative count of Article Views (full-text article views including HTML views, PDF and ePub downloads, according to the available data) and Abstracts Views on Vision4Press platform.
Data correspond to usage on the plateform after 2015. The current usage metrics is available 48-96 hours after online publication and is updated daily on week days.
Initial download of the metrics may take a while.