Fig. A.1.
Download original image
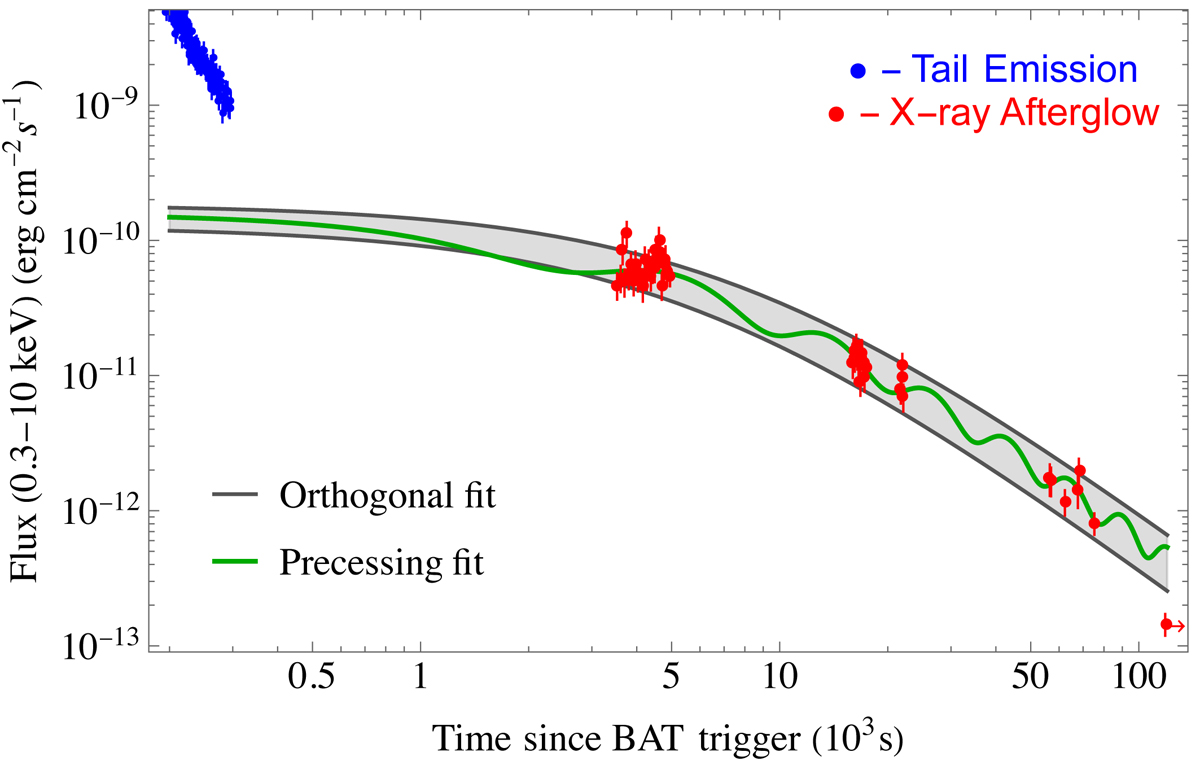
Afterglow light-curve fittings for GRB 211211A. Blue data are attributable to the decaying tail of the prompt emission (Evans et al. 2014), while red data may be contributed by a newborn magnetar. The grey band shows the 95% confidence interval for an orthogonal-rotator fit, while the green curve shows a best-fit precessing model.
Current usage metrics show cumulative count of Article Views (full-text article views including HTML views, PDF and ePub downloads, according to the available data) and Abstracts Views on Vision4Press platform.
Data correspond to usage on the plateform after 2015. The current usage metrics is available 48-96 hours after online publication and is updated daily on week days.
Initial download of the metrics may take a while.