Fig. 6.
Download original image
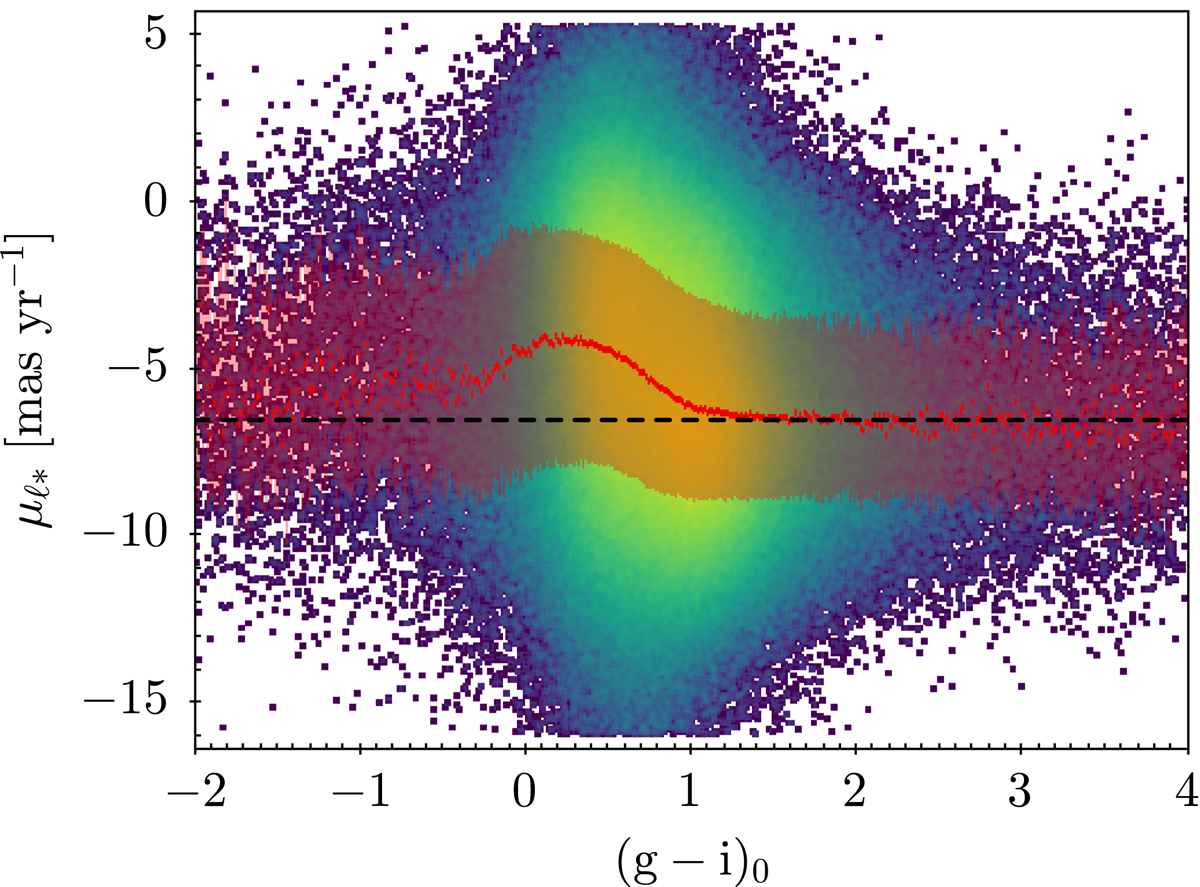
Distribution of proper motion in Galactic longitude as a function of colour for the ϖ-background sources in Baade’s window. The red curve is the median value of μℓ* for each bin in (g − i)0, and the width of the red band is computed using the 16th and the 84th percentiles of the distribution of proper motions in each bin. The black dashed horizontal line corresponds to the mean of the Gaussian fitted to the distribution of the bulge stars.
Current usage metrics show cumulative count of Article Views (full-text article views including HTML views, PDF and ePub downloads, according to the available data) and Abstracts Views on Vision4Press platform.
Data correspond to usage on the plateform after 2015. The current usage metrics is available 48-96 hours after online publication and is updated daily on week days.
Initial download of the metrics may take a while.