Fig. C.1.
Download original image
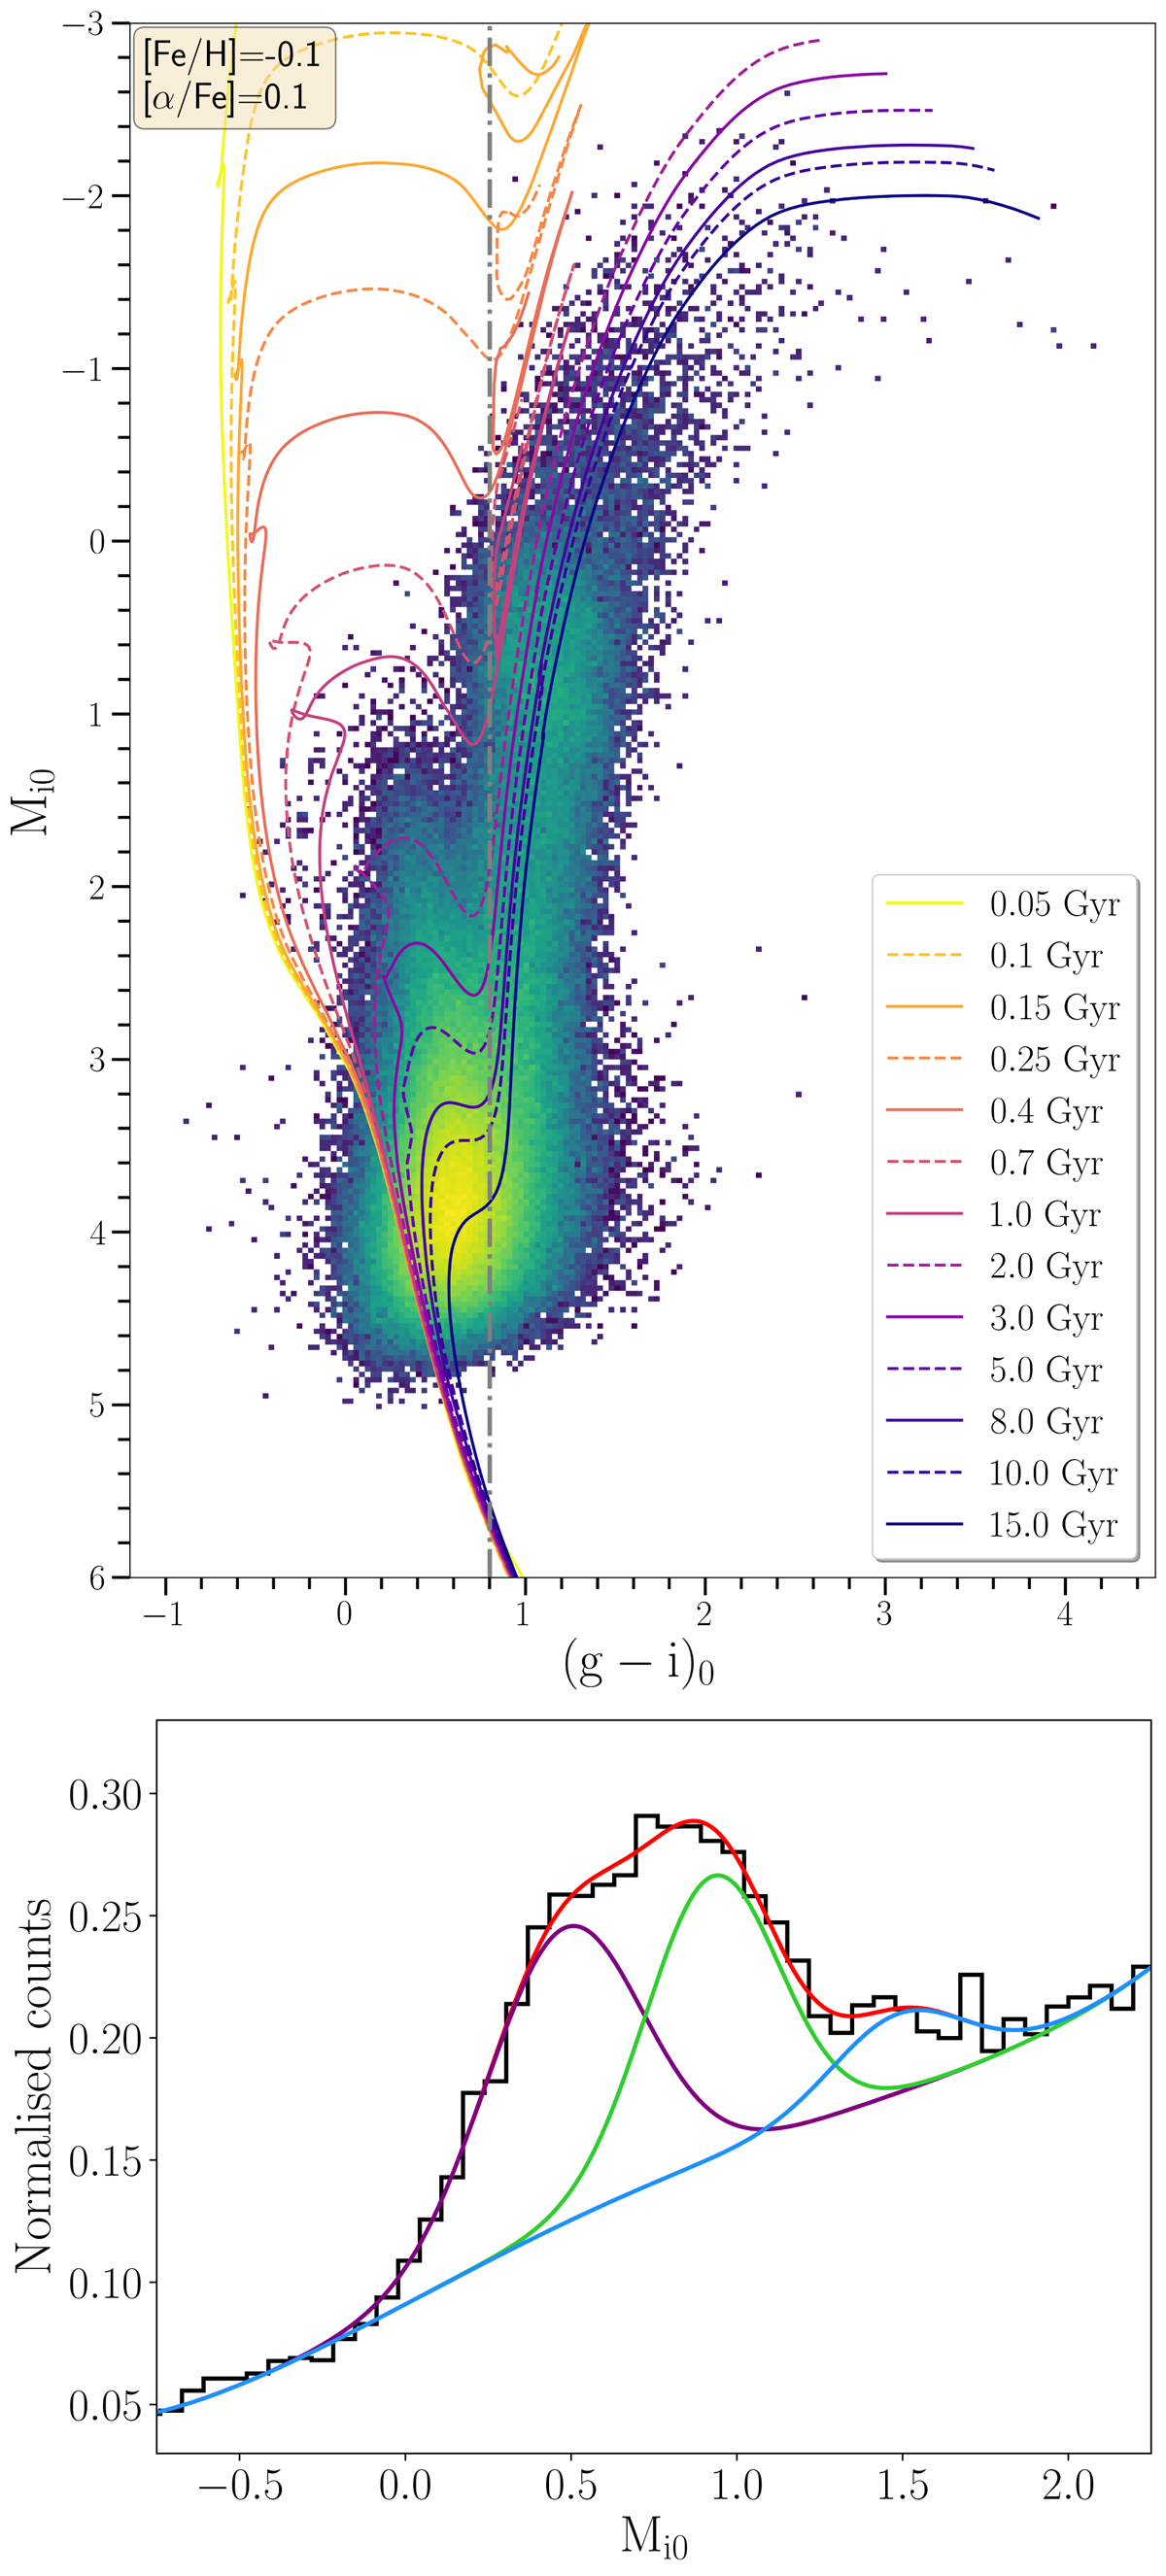
Top: Clean bulge de-reddened CMD for sources within 1° from (ℓ,b) = (0° , − 6° ), with overplotted a selection of MIST isochrones with [Fe/H]= − 0.1 and [α/Fe]= + 0.1. Bottom: distribution absolute magnitudes for sources with (g − i)0 ≥ 0.8 (dash-dotted line in top panel), with Gaussian fits to the double RC (purple and green curve) and to the RGB bump (blue curve).
Current usage metrics show cumulative count of Article Views (full-text article views including HTML views, PDF and ePub downloads, according to the available data) and Abstracts Views on Vision4Press platform.
Data correspond to usage on the plateform after 2015. The current usage metrics is available 48-96 hours after online publication and is updated daily on week days.
Initial download of the metrics may take a while.