Fig. 2.
Download original image
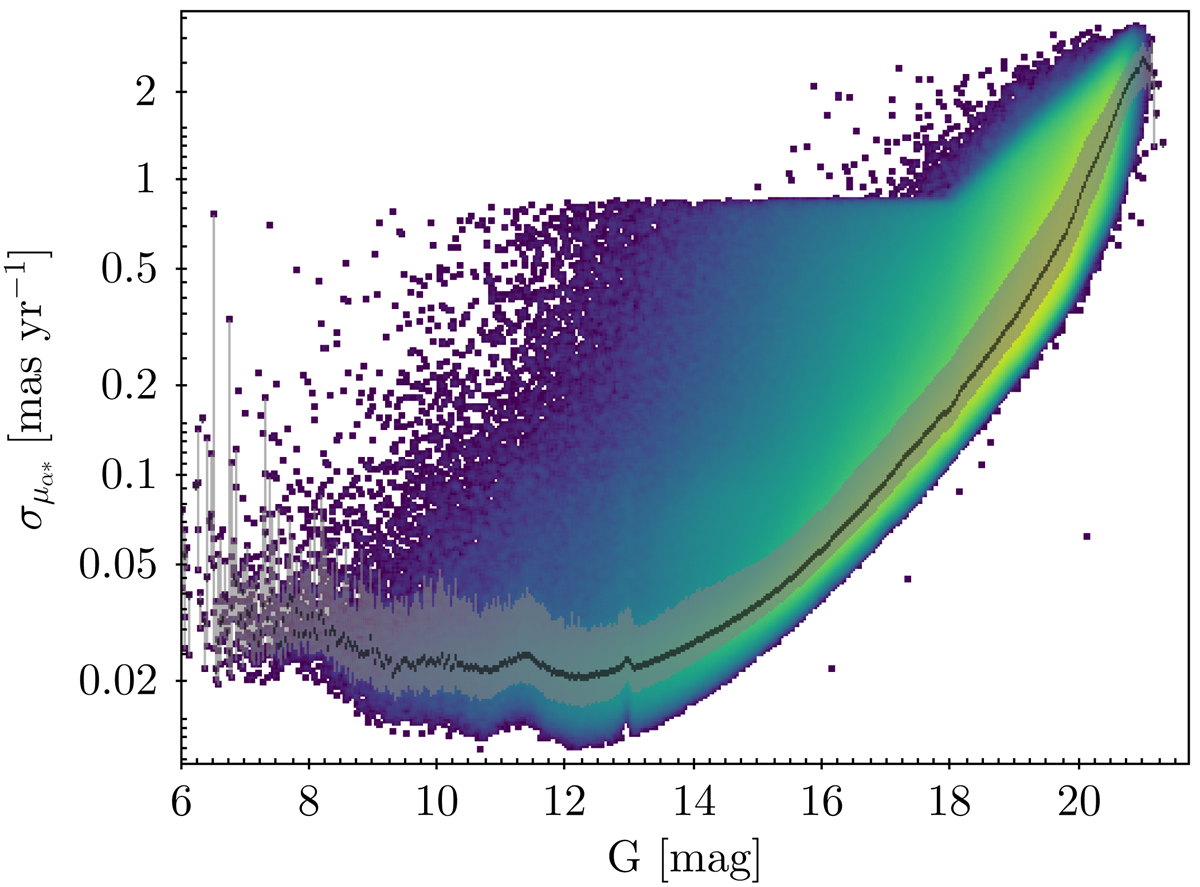
Uncertainties in Gaia EDR3 proper motions in right ascension as a function of G magnitude for all the sources in the BDBS/Gaia EDR3 matched catalogue. The median value is shown with a solid black line, and the grey shaded area corresponds to the 1-sigma confidence interval, computed using the 16th and 84th percentiles of the distribution.
Current usage metrics show cumulative count of Article Views (full-text article views including HTML views, PDF and ePub downloads, according to the available data) and Abstracts Views on Vision4Press platform.
Data correspond to usage on the plateform after 2015. The current usage metrics is available 48-96 hours after online publication and is updated daily on week days.
Initial download of the metrics may take a while.