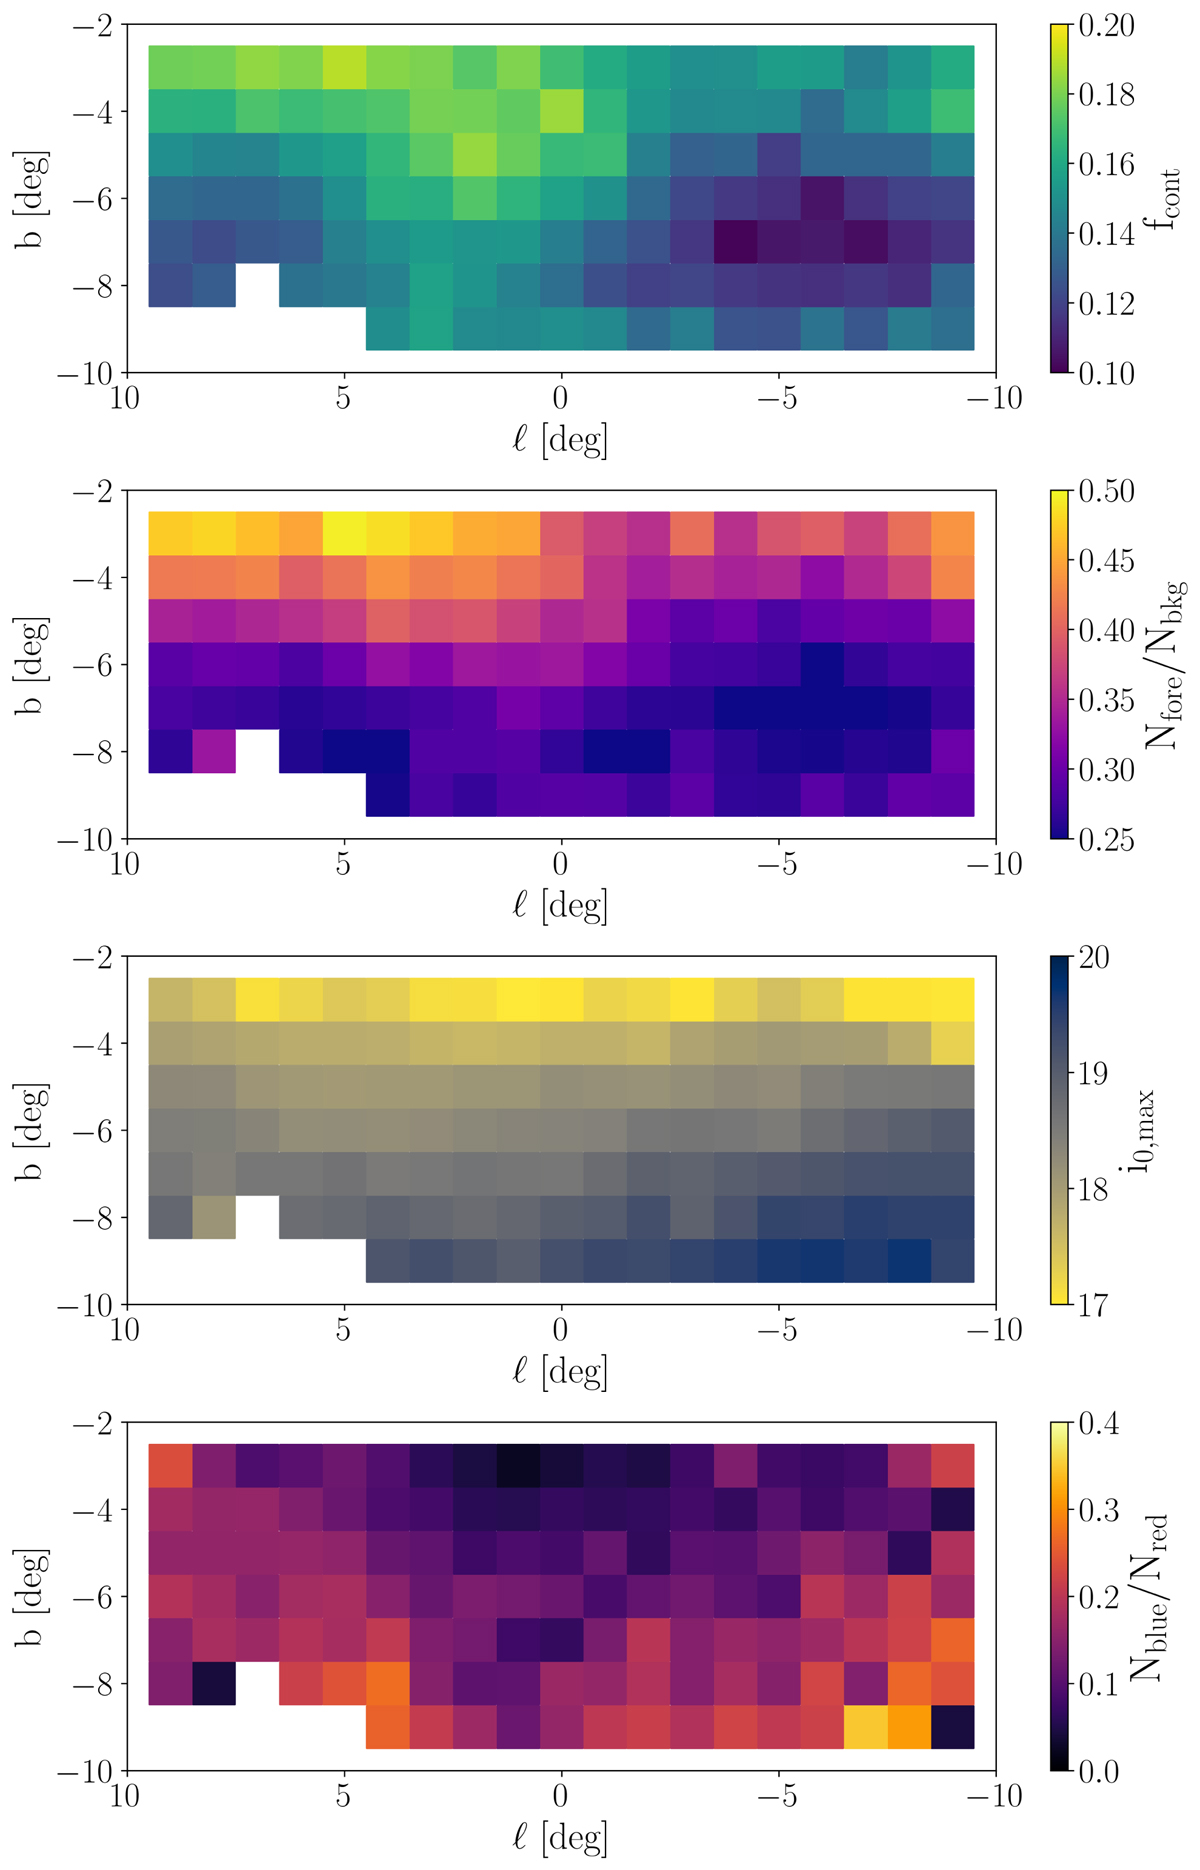
Fig. 13.
Download original image
First row: maximum contamination to the bulge CMDs from stars with proper motions consistent with belonging to the foreground population. Second row: ratio of foreground to background stars. Third row: maximum of the i0 distribution (for i0 > 17). Fourth Row: ratio of blue to red stars, when only stars with i0 ≤ i0, max − 3σi are considered. All the plots are shown as a function of Galactic coordinates, for the bulge fields shown in Fig. 1.
Current usage metrics show cumulative count of Article Views (full-text article views including HTML views, PDF and ePub downloads, according to the available data) and Abstracts Views on Vision4Press platform.
Data correspond to usage on the plateform after 2015. The current usage metrics is available 48-96 hours after online publication and is updated daily on week days.
Initial download of the metrics may take a while.