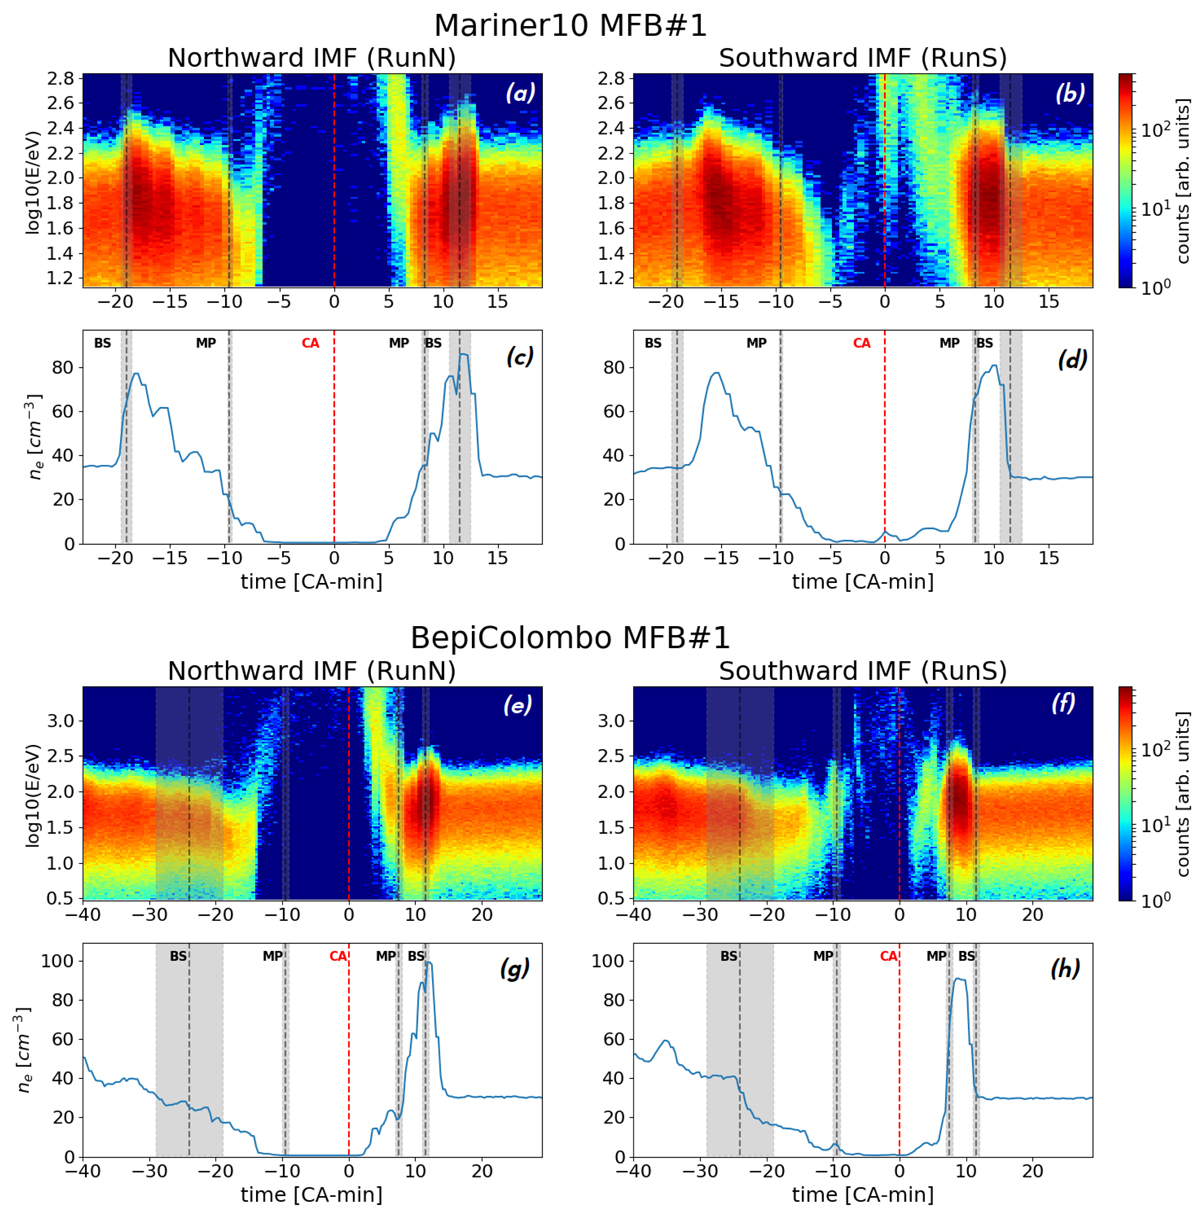
Fig. 6.
Download original image
Synthetic electron energy distribution functions (eEDFs) sampled along Mariner10 (a)–(d) and BepiColombo (e)–(h) first Mercury flybys in our simulation boxes using northward IMF (left panels) and southward IMF (right panels) conditions. The plots are done using simulation results at time = 14.7R/Vx. The energy ranges and resolutions used to compute the eEDF are the same as those of the instruments PLS (onboard Mariner, top) and MEA1 (onboard BepiColombo, bottom). The horizontal axis shows the time from closest approach (CA) in minutes, and t = 0 is highlighted using vertical red dashed line. On the time axis, we highlight the bow shock and magnetopause crossings obtained by the two spacecraft in situ. These are highlighted using gray areas and vertical black dashed lines. The electron density was obtained by integrating the synthetic eEDF in energy at each given time.
Current usage metrics show cumulative count of Article Views (full-text article views including HTML views, PDF and ePub downloads, according to the available data) and Abstracts Views on Vision4Press platform.
Data correspond to usage on the plateform after 2015. The current usage metrics is available 48-96 hours after online publication and is updated daily on week days.
Initial download of the metrics may take a while.