Fig. 5.
Download original image
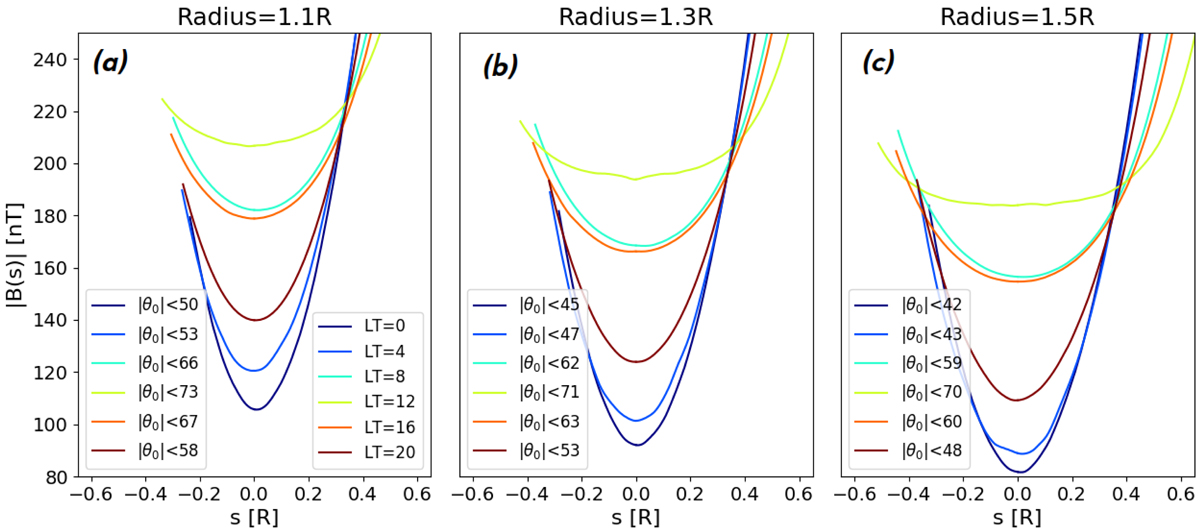
Magnetic field amplitude along magnetic field lines |B(s)| [nT] computed at different local times (LT). LT 12 corresponds to subsolar longitude (yellow) and LT 0 corresponds to local midnight (dark blue). Panels (a)–(c) correspond to different equatorial distances from the center of the planet: 1.1 R (a), 1.3 R (b), and 1.5 R (c). Resulting values for the loss-cone angle from Eq. (3) are also shown in each panel. Plots done at a time of 15.9 R/Vx, which is the same as in Figs. 1–4.
Current usage metrics show cumulative count of Article Views (full-text article views including HTML views, PDF and ePub downloads, according to the available data) and Abstracts Views on Vision4Press platform.
Data correspond to usage on the plateform after 2015. The current usage metrics is available 48-96 hours after online publication and is updated daily on week days.
Initial download of the metrics may take a while.