Fig. 4.
Download original image
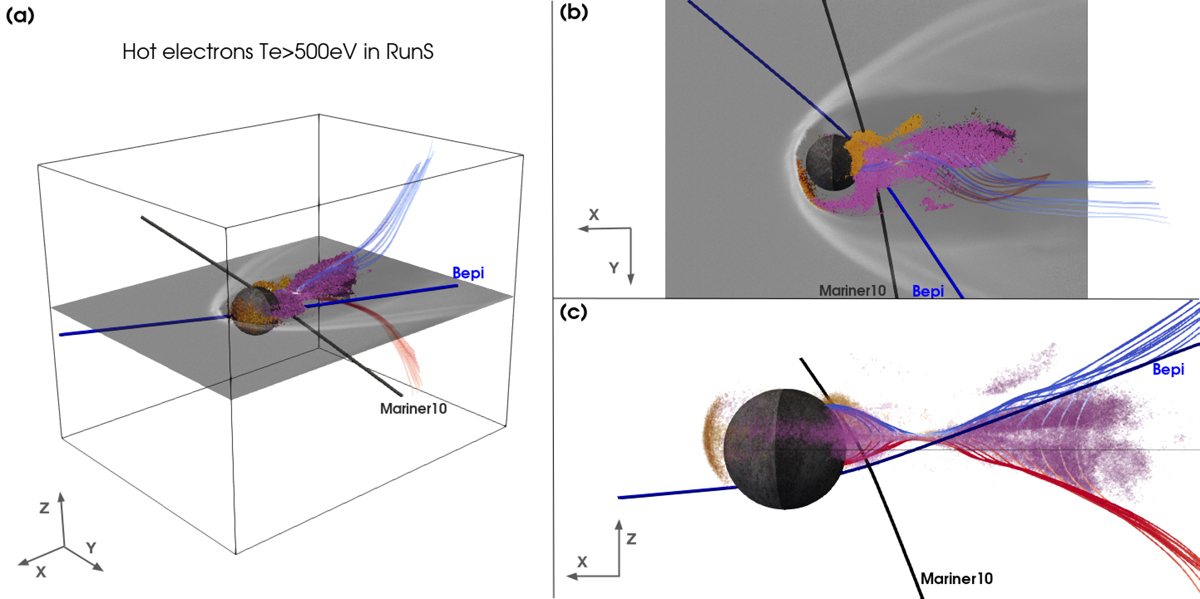
Three-dimensional view of high-energy electron population in simulation RunS. The three panels show three different views of the same quantities. Grid cells with values of perpendicular (parallel) temperatures greater than 500 eV are shown in orange (purple). We show an equatorial cut of the electron density in grayscale. Magnetic field lines are shown around the neutral point in the tail, and these lines are colored according to the value of Bx (blue and red for sunward and antisunward directions, respectively). Both quantities are computed at a time of 15.9 R/Vx, which is the same as in Figs. 1 and 2. Mariner10 and BepiColombo first Mercury flyby trajectories are shown using gray and blue solid lines, respectively.
Current usage metrics show cumulative count of Article Views (full-text article views including HTML views, PDF and ePub downloads, according to the available data) and Abstracts Views on Vision4Press platform.
Data correspond to usage on the plateform after 2015. The current usage metrics is available 48-96 hours after online publication and is updated daily on week days.
Initial download of the metrics may take a while.