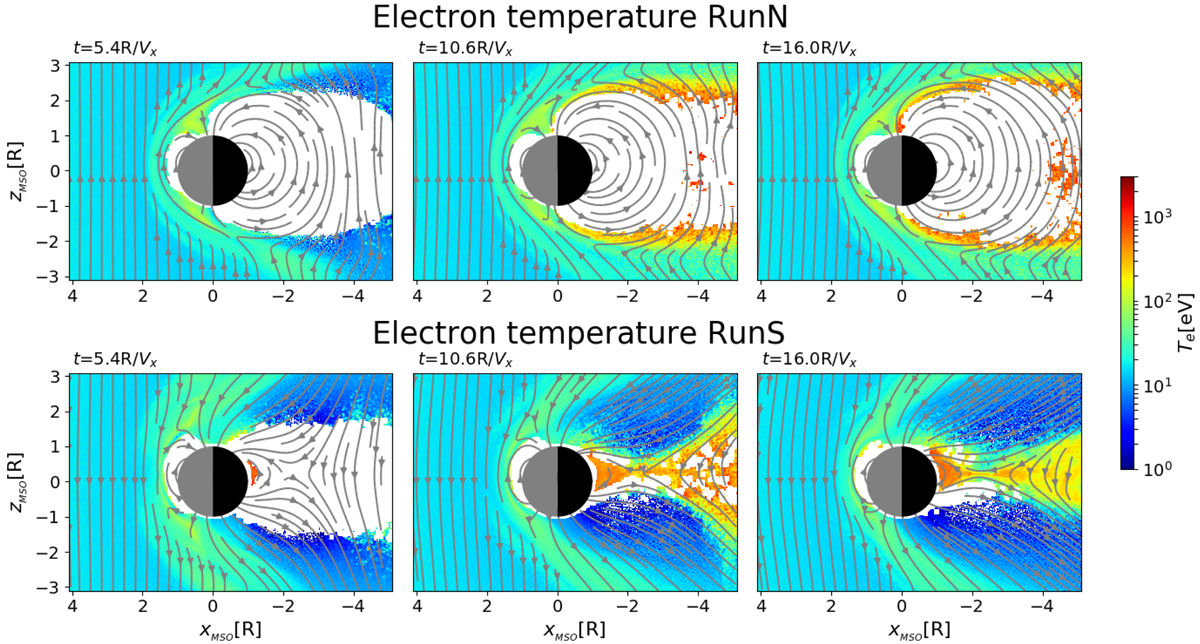
Fig. 3.
Download original image
Time evolution of electron temperature in nose and tail reconnection regions. Dipolar YMSO = 0 cut of simulations RunN (top panels) and RunS (bottom panels) at different times (time advancing from left to right). We show the color map of the electron temperature Te = (2T⊥, e + T∥, e)/3 in units of [eV] in logarithmic scale. On top of that, we superpose the in-plane magnetic field lines (gray solid lines). The white region around the planet corresponds to grid cells with a number of macro-particles too small to reliably compute the value of Te.
Current usage metrics show cumulative count of Article Views (full-text article views including HTML views, PDF and ePub downloads, according to the available data) and Abstracts Views on Vision4Press platform.
Data correspond to usage on the plateform after 2015. The current usage metrics is available 48-96 hours after online publication and is updated daily on week days.
Initial download of the metrics may take a while.