Fig. 2.
Download original image
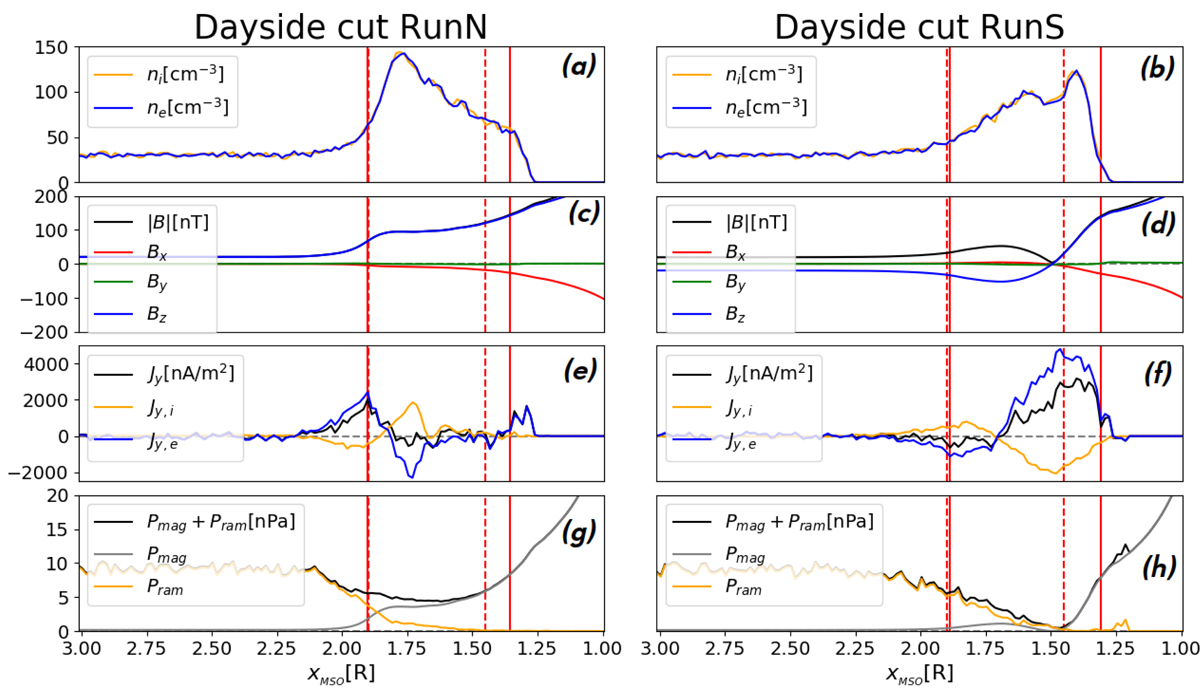
Cut of results of our two simulations RunN (left panels) and RunS (right panels) along the subsolar line (x-axis). Panels a–b: proton and electron densities. Panels c–d: magnetic field components and amplitude. Panels e–f: current density along YMSO of protons, electrons, and total. Panels g–h: magnetic Pmag ≡ B2/2μ0, ram ![]() , and total pressures. These cuts were performed at the same time as Fig. 1 (t = 15.9 R/Vx). We highlight the bow shock and magnetopause stand-off distances obtained from our model (solid red vertical lines) and the ones obtained using the average model of Winslow et al. (2013) constrained by MESSENGER observations (dashed red vertical lines).
, and total pressures. These cuts were performed at the same time as Fig. 1 (t = 15.9 R/Vx). We highlight the bow shock and magnetopause stand-off distances obtained from our model (solid red vertical lines) and the ones obtained using the average model of Winslow et al. (2013) constrained by MESSENGER observations (dashed red vertical lines).
Current usage metrics show cumulative count of Article Views (full-text article views including HTML views, PDF and ePub downloads, according to the available data) and Abstracts Views on Vision4Press platform.
Data correspond to usage on the plateform after 2015. The current usage metrics is available 48-96 hours after online publication and is updated daily on week days.
Initial download of the metrics may take a while.