Fig. 1.
Download original image
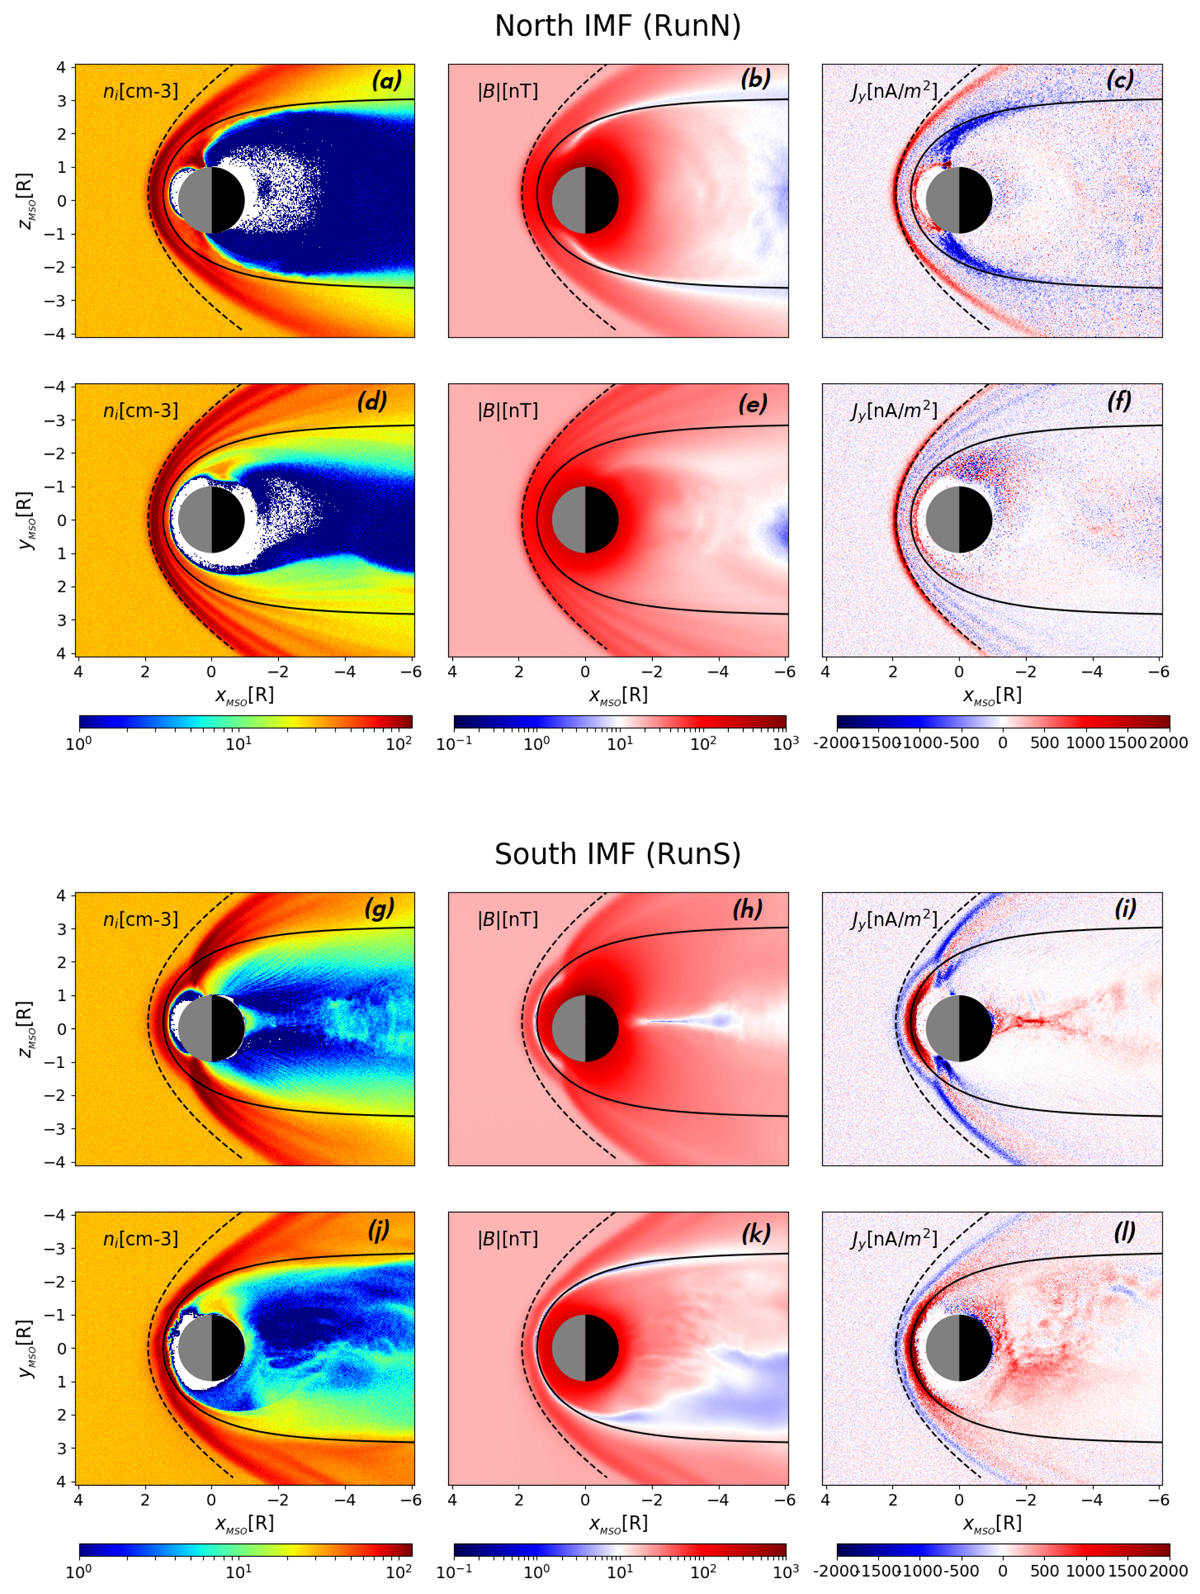
Overview of large-scale structure and magnetosphere boundaries in our simulations. Panels a–f show the results of RunN. Panels a–c show dipolar YMSO = 0 cuts of the ion density ni (a), magnetic field amplitude |B| (b), and plasma current density along the y-axis Jy (c). Panels d–f show equatorial ZMSO = 0 cuts of the same quantities for RunN. Panels g–l show the results of RunS in the same format as those of RunN. All plots represent a time of t = 15.9 R/Vx. The average bow shock (dashed black line) and magnetopause (solid black line) profiles found by Winslow et al. (2013) using MESSENGER observations are added. The white region around the planet corresponds to grid cells with zero macro-particles.
Current usage metrics show cumulative count of Article Views (full-text article views including HTML views, PDF and ePub downloads, according to the available data) and Abstracts Views on Vision4Press platform.
Data correspond to usage on the plateform after 2015. The current usage metrics is available 48-96 hours after online publication and is updated daily on week days.
Initial download of the metrics may take a while.