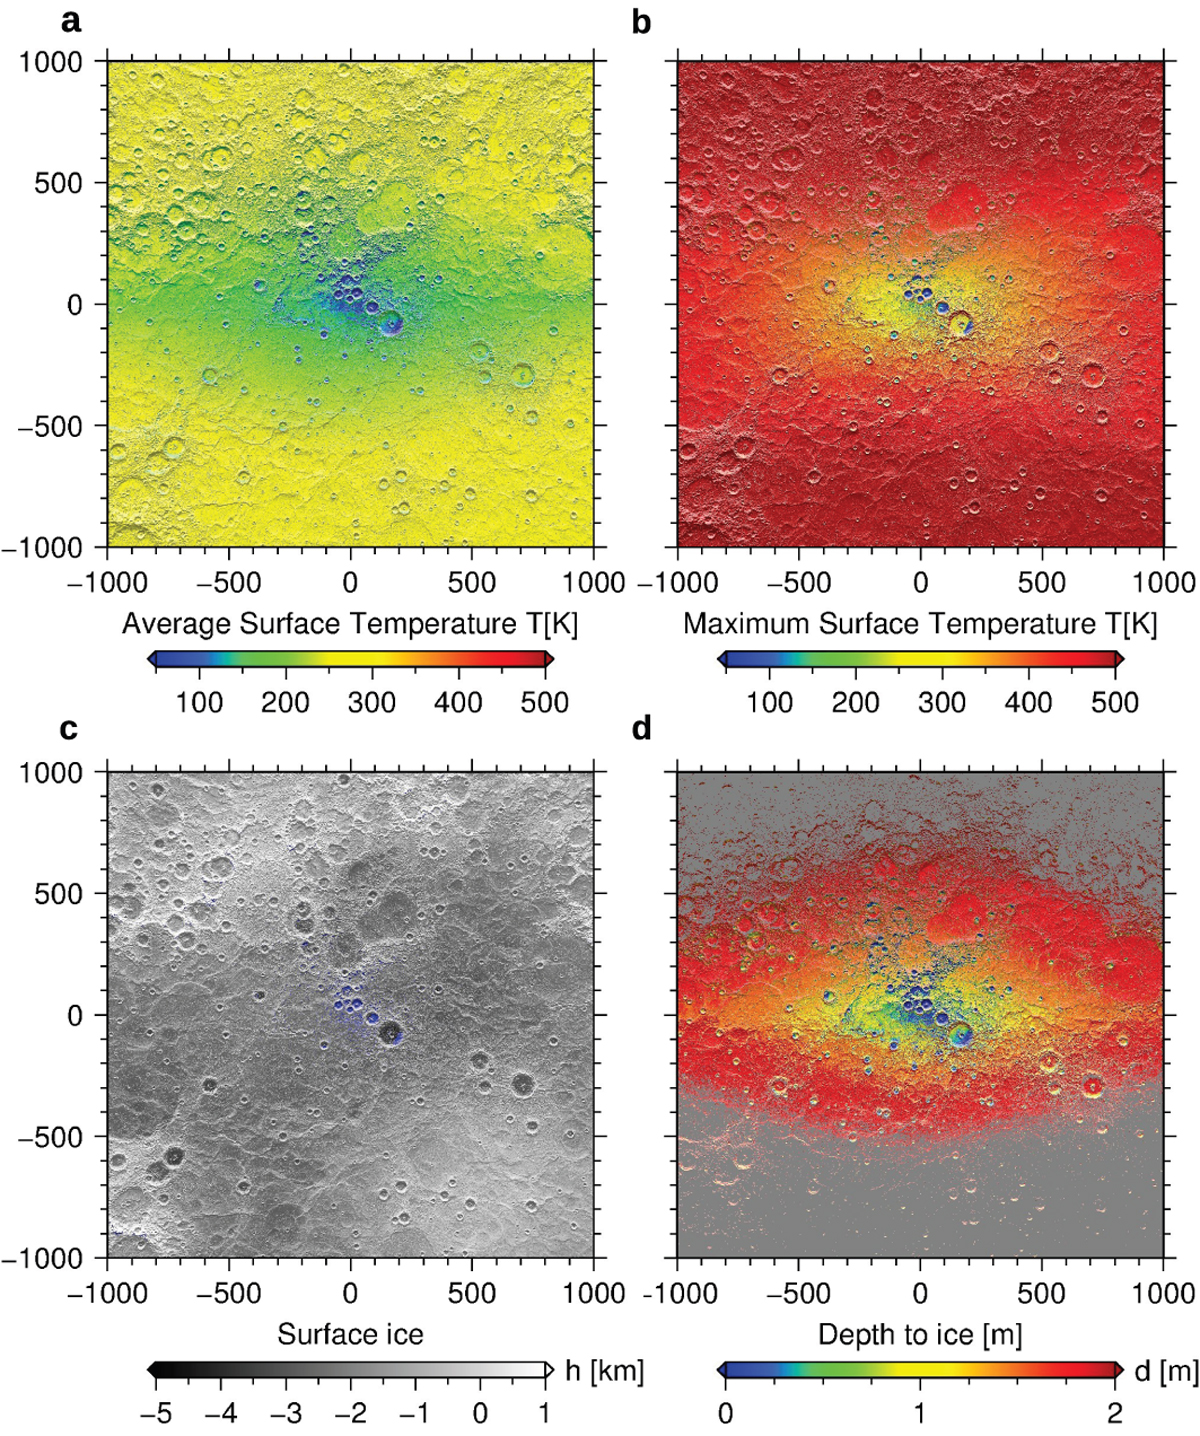
Fig. 9
Download original image
Temperature maps of the north polar region. The maps are displayed in gnomonic map projection centered at the north pole and color-coded by temperature (a,b), height (c), and depths (d). Axis units are in kilometers. (a): average temperature map. (b): maximum temperature map. (c): location of possible surface ice (blue). (d): depth-to-ice map for the upper 2 m of regolith derived from the maximum temperature where temperatures are below 112 K.
Current usage metrics show cumulative count of Article Views (full-text article views including HTML views, PDF and ePub downloads, according to the available data) and Abstracts Views on Vision4Press platform.
Data correspond to usage on the plateform after 2015. The current usage metrics is available 48-96 hours after online publication and is updated daily on week days.
Initial download of the metrics may take a while.