Fig. 7
Download original image
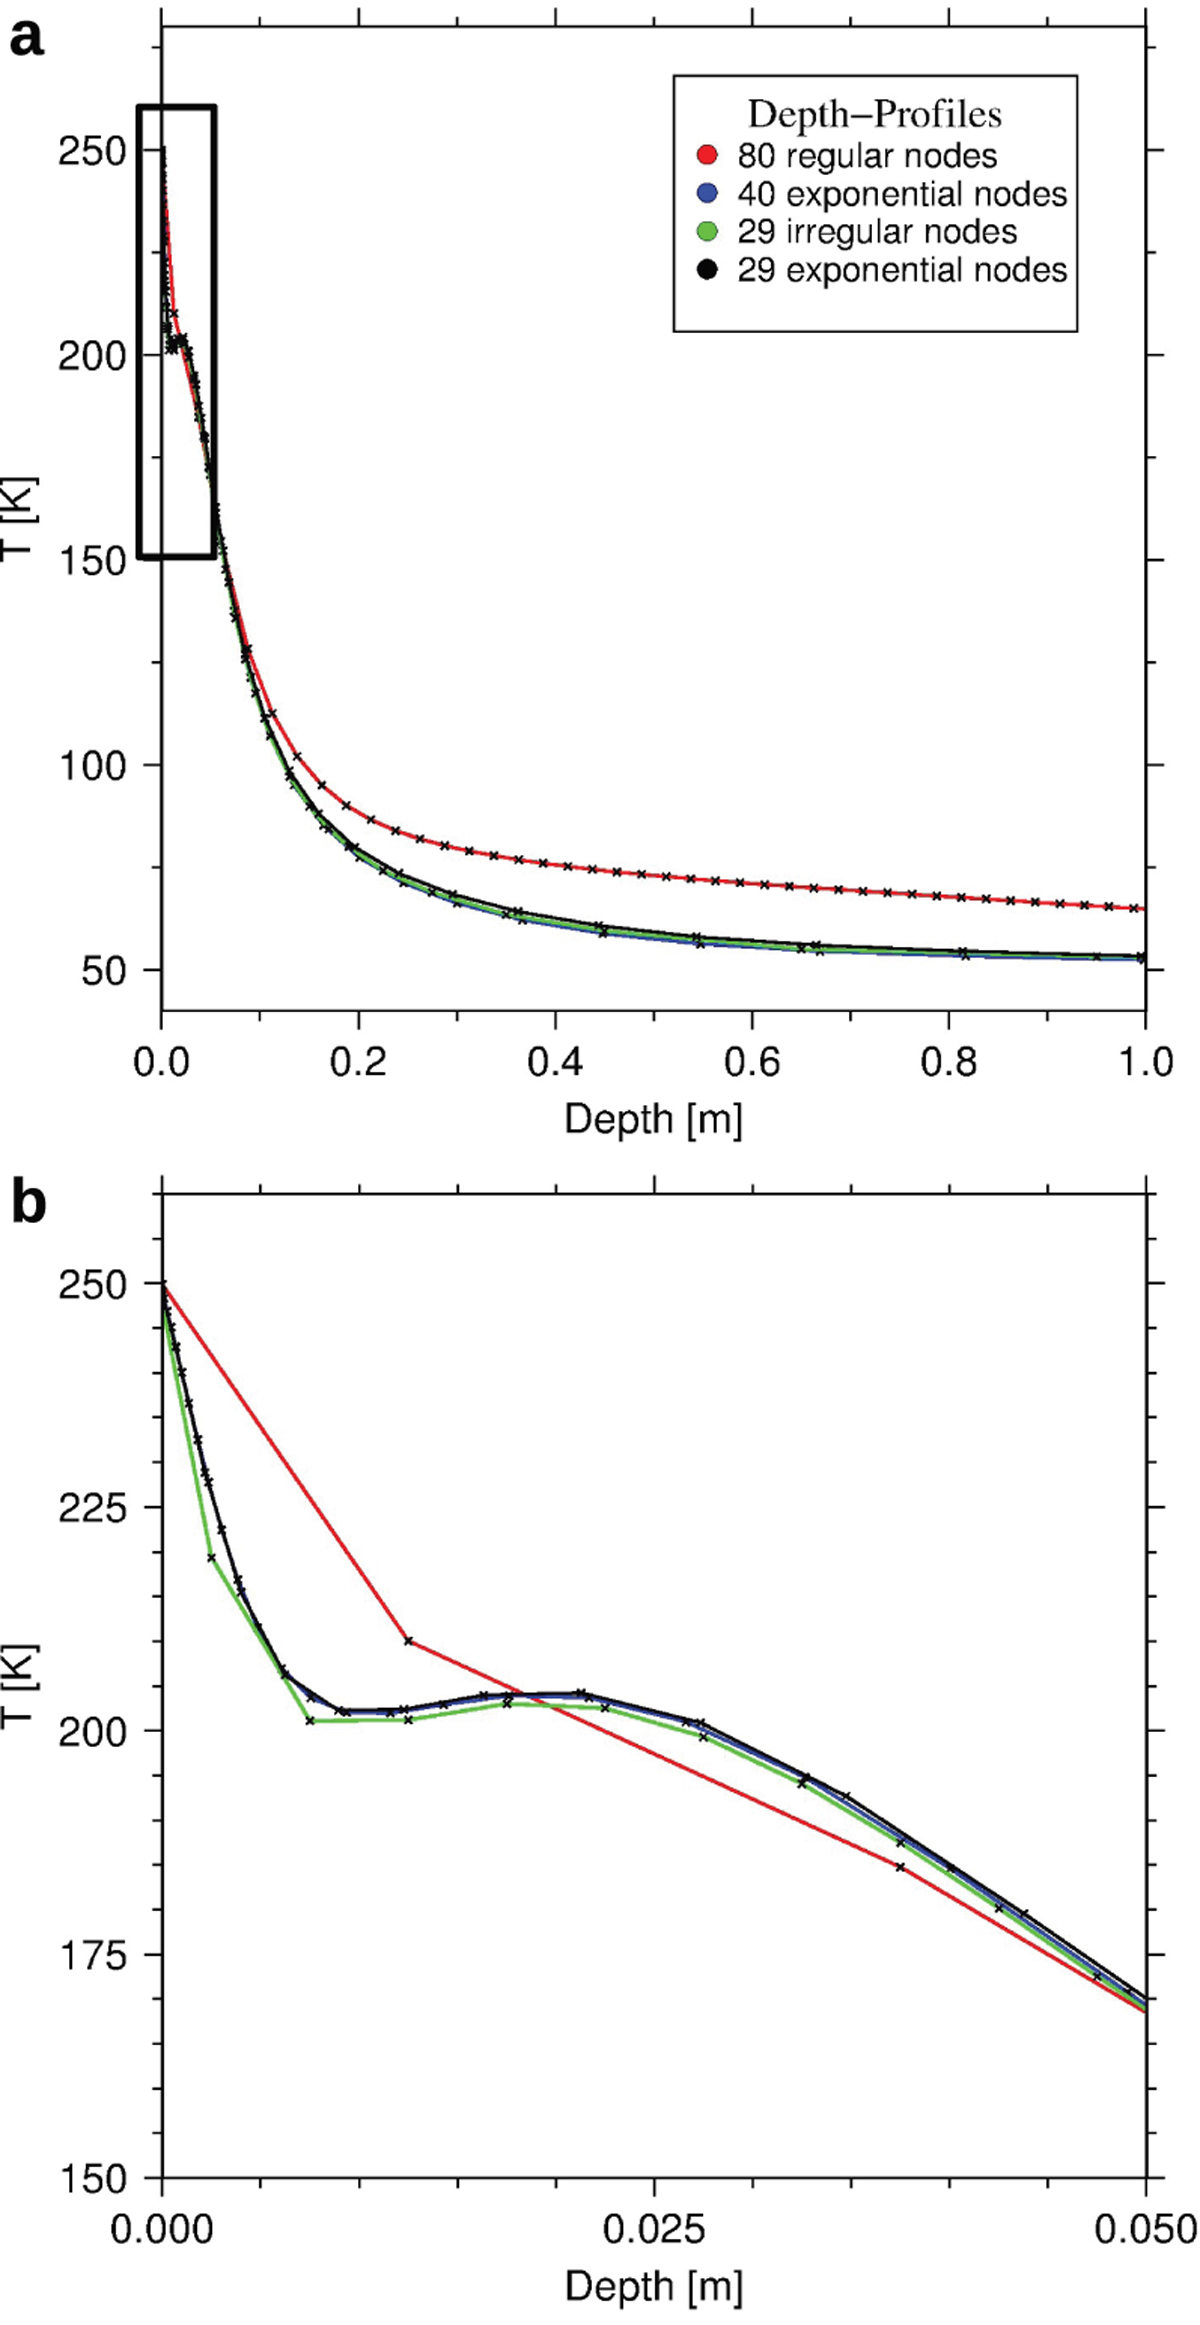
Temperature profiles in the subsurface using different node-spacing approaches and a different number of nodes. (a): temperature distribution in the upper 1 m of regolith. The regular node spacing with 80 nodes (red) cannot resolve the upper temperature distribution and it propagates inaccurate temperature estimates to the subsurface, leading to a profile that is vastly different than the other three approaches. The two exponential node spacing approaches, 40 nodes (blue) and 29 nodes (black), and the irregular 29-nodes spacing approach (green) follow the same trend and provide similar temperatures. (b): same profiles as in (a), but for the upper 5 cm of regolith. The regularly spaced profile (red) is too poorly resolved close to the surface to model the temperature distribution. The other three approaches show a similar trend with the two exponential approaches showing smoother and higher resolved temperature profiles than the previously chosen irregular node spacing.
Current usage metrics show cumulative count of Article Views (full-text article views including HTML views, PDF and ePub downloads, according to the available data) and Abstracts Views on Vision4Press platform.
Data correspond to usage on the plateform after 2015. The current usage metrics is available 48-96 hours after online publication and is updated daily on week days.
Initial download of the metrics may take a while.