Fig. 6
Download original image
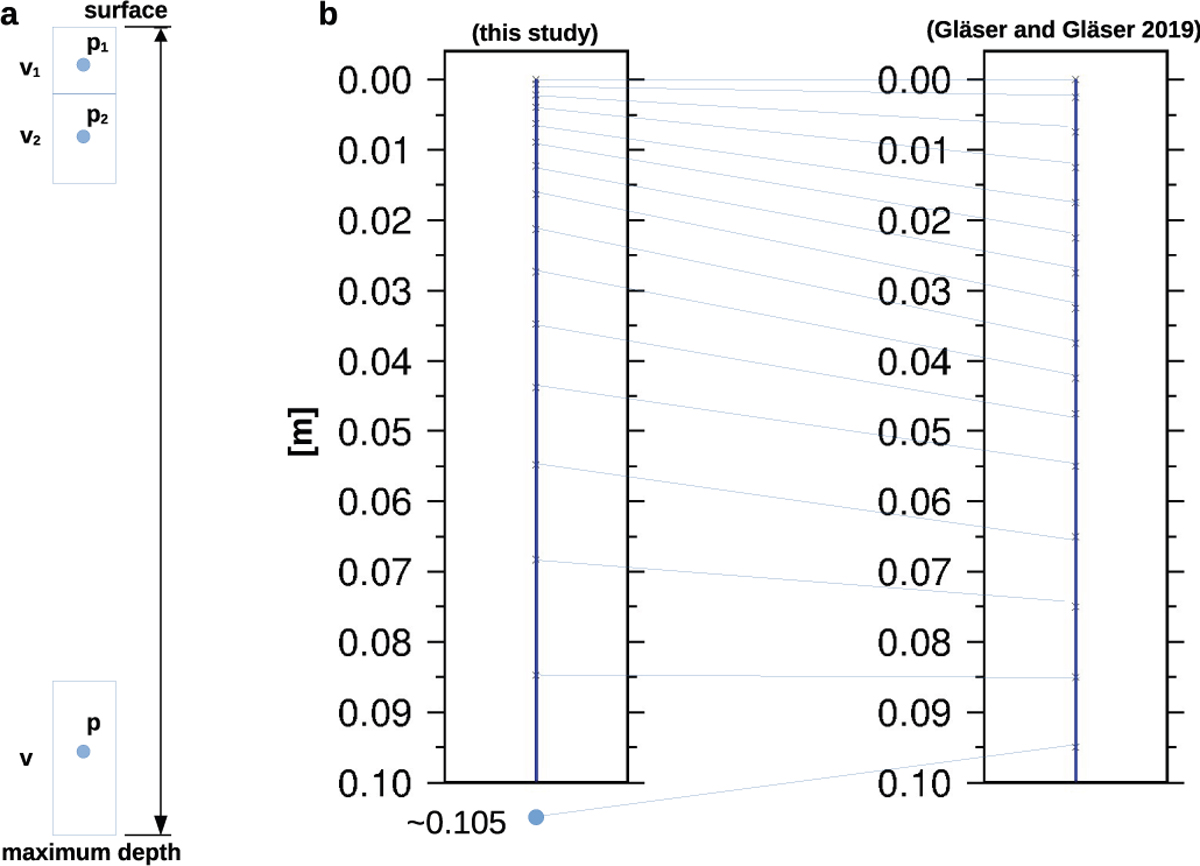
(a): sketch of a depth profile derived by the exponential approach. Node distances and volume sizes increase in an exponential manner with greater depths. (b): comparison of the upper 10 cm (≈16 nodes) of the exponential 29-nodes approach adopted for this study and the irregular 29-nodes approach in the previous study of Gläser & Gläser (2019). We note the higher node density close to the surface in the new approach leading to finer resolution of the nonlinear behavior of the temperature distribution.
Current usage metrics show cumulative count of Article Views (full-text article views including HTML views, PDF and ePub downloads, according to the available data) and Abstracts Views on Vision4Press platform.
Data correspond to usage on the plateform after 2015. The current usage metrics is available 48-96 hours after online publication and is updated daily on week days.
Initial download of the metrics may take a while.