Fig. 1
Download original image
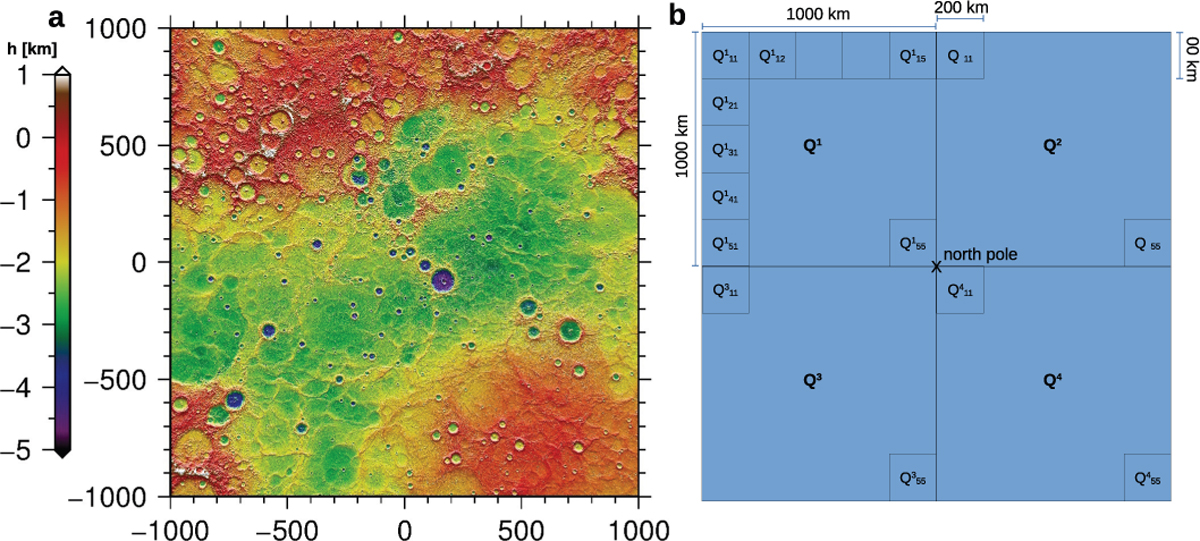
DTM and applied tiling scheme. (a): shaded MLA DTM of Mercury’s north pole at a resolution of 250 m pixel−1. The map is displayed in gnomonic map projection centered at the north pole and color-coded by height. All units are in kilometers. (b): applied tiling scheme to derive temperatures for the DTM in (a). In total, 100 square tiles, each with a dimension of 200 × 200 km, make up the entire polar region of 2000 × 2000 km.
Current usage metrics show cumulative count of Article Views (full-text article views including HTML views, PDF and ePub downloads, according to the available data) and Abstracts Views on Vision4Press platform.
Data correspond to usage on the plateform after 2015. The current usage metrics is available 48-96 hours after online publication and is updated daily on week days.
Initial download of the metrics may take a while.