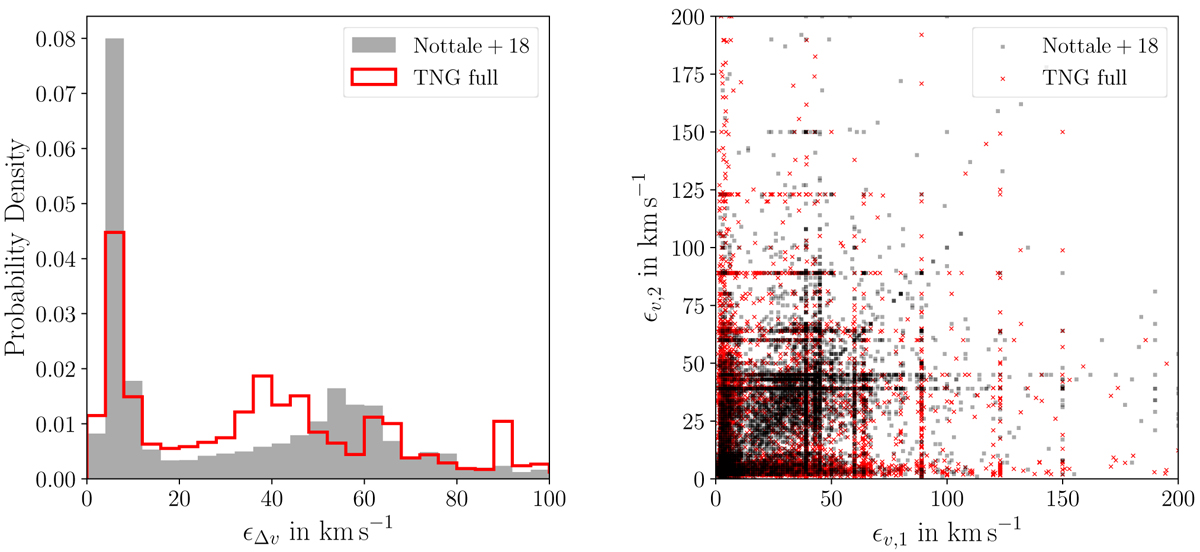
Fig. A.2.
Download original image
Comparison of velocity errors for the observed and simulated galaxy pair samples. Left panel: Distribution of errors ϵΔv on the line-of-sight velocity difference Δv of galaxy pairs. Right panel: Errors on individual velocity measurements for the two corresponding partner galaxies (more luminous partner on the horizontal axis). Some error correlation is present for the observed sample, but absent in our mock observed simulation data.
Current usage metrics show cumulative count of Article Views (full-text article views including HTML views, PDF and ePub downloads, according to the available data) and Abstracts Views on Vision4Press platform.
Data correspond to usage on the plateform after 2015. The current usage metrics is available 48-96 hours after online publication and is updated daily on week days.
Initial download of the metrics may take a while.