Fig. 3.
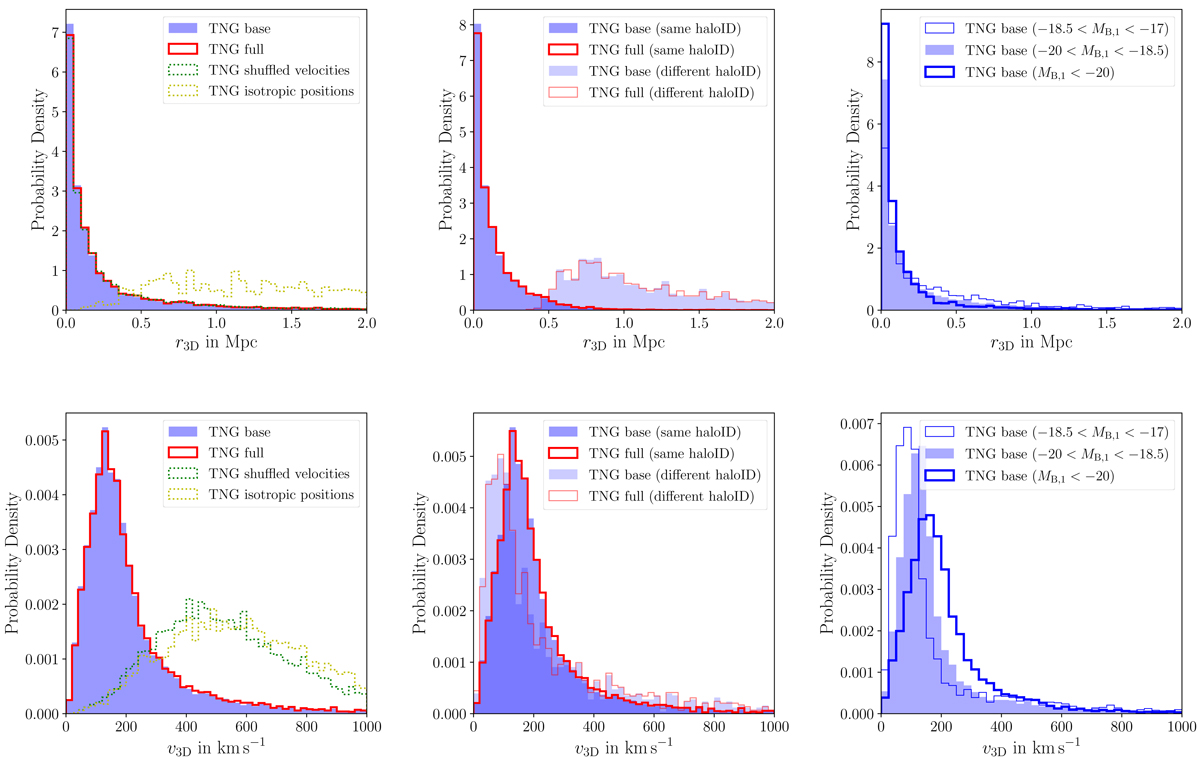
Download original image
Full 3D separation r3D (top panels) and 3D intervelocity v3D (bottom panels) for our base (blue shaded histograms) and full (red solid line) simulation galaxy pair catalogs. Left panels show a comparison with the two randomized samples for which either only the galaxy velocities were shuffled among all considered galaxies or their positions were randomly drawn from a uniform distribution. The middle panels show a comparison among galaxy pairs that share a common halo ID in the simulation with those that do not. Right panels show a comparison of the results for different ranges of the pair primary’s absolute magnitude.
Current usage metrics show cumulative count of Article Views (full-text article views including HTML views, PDF and ePub downloads, according to the available data) and Abstracts Views on Vision4Press platform.
Data correspond to usage on the plateform after 2015. The current usage metrics is available 48-96 hours after online publication and is updated daily on week days.
Initial download of the metrics may take a while.