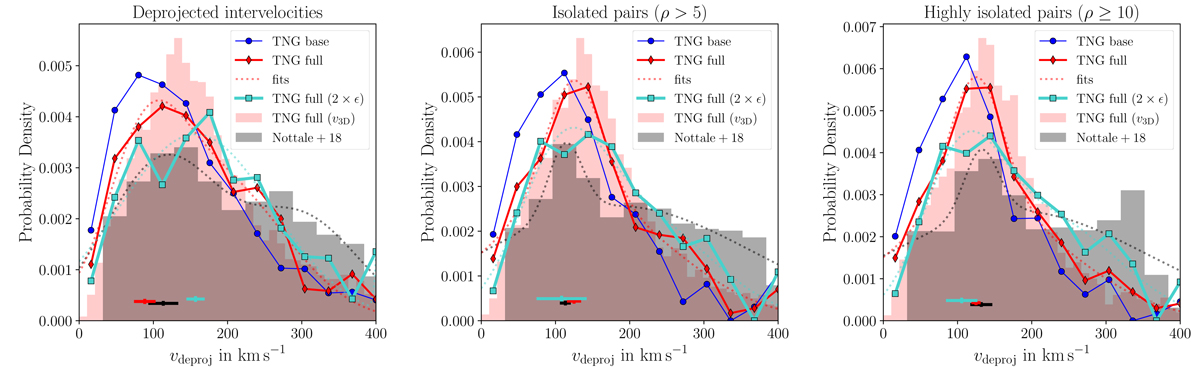
Fig. 2.
Download original image
Deprojected velocities for the observed pairs (grey) and mock-observed simulation without (blue), with (red), and with doubled (turquoise) velocity errors. The light-red histogram in the background shows the v3D intervelocity distribution for the full sample, as determined from the peculiar velocity difference of the galaxy pairs using the available full phase-space information of the simulation. Also shown are the two-Gaussian model fits to the histograms used to determine the positions of the velocity peak. The peak position and its 1σ-uncertainty are indicated by solid lines at the bottom of the figure.
Current usage metrics show cumulative count of Article Views (full-text article views including HTML views, PDF and ePub downloads, according to the available data) and Abstracts Views on Vision4Press platform.
Data correspond to usage on the plateform after 2015. The current usage metrics is available 48-96 hours after online publication and is updated daily on week days.
Initial download of the metrics may take a while.