Fig. 2
Download original image
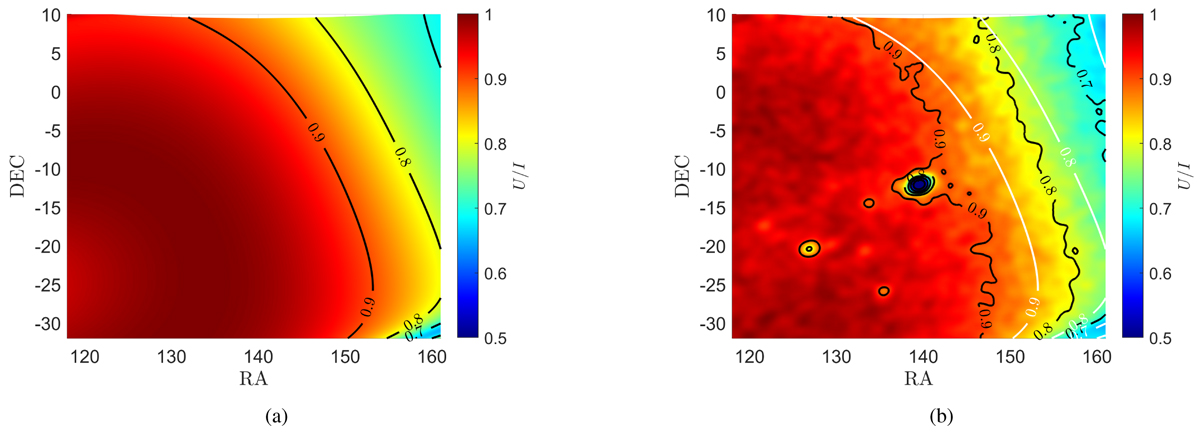
Side-by-side comparison of the ratio of the simulated and observed SEFDU/SEFDI at gridpoint 114. (a) Simulated image of SEFDU/SEFDI with the corresponding contour levels. (b) Observed SEFDU/SEFDI with the corresponding contour levels (black curves) and the contour levels of the simulated values (white curves). The observed image has a size of 4096 × 4096 pixels and was smoothed using a Gaussian filter of size 201 × 201 to smooth the noisy image.
Current usage metrics show cumulative count of Article Views (full-text article views including HTML views, PDF and ePub downloads, according to the available data) and Abstracts Views on Vision4Press platform.
Data correspond to usage on the plateform after 2015. The current usage metrics is available 48-96 hours after online publication and is updated daily on week days.
Initial download of the metrics may take a while.