Fig. 7.
Download original image
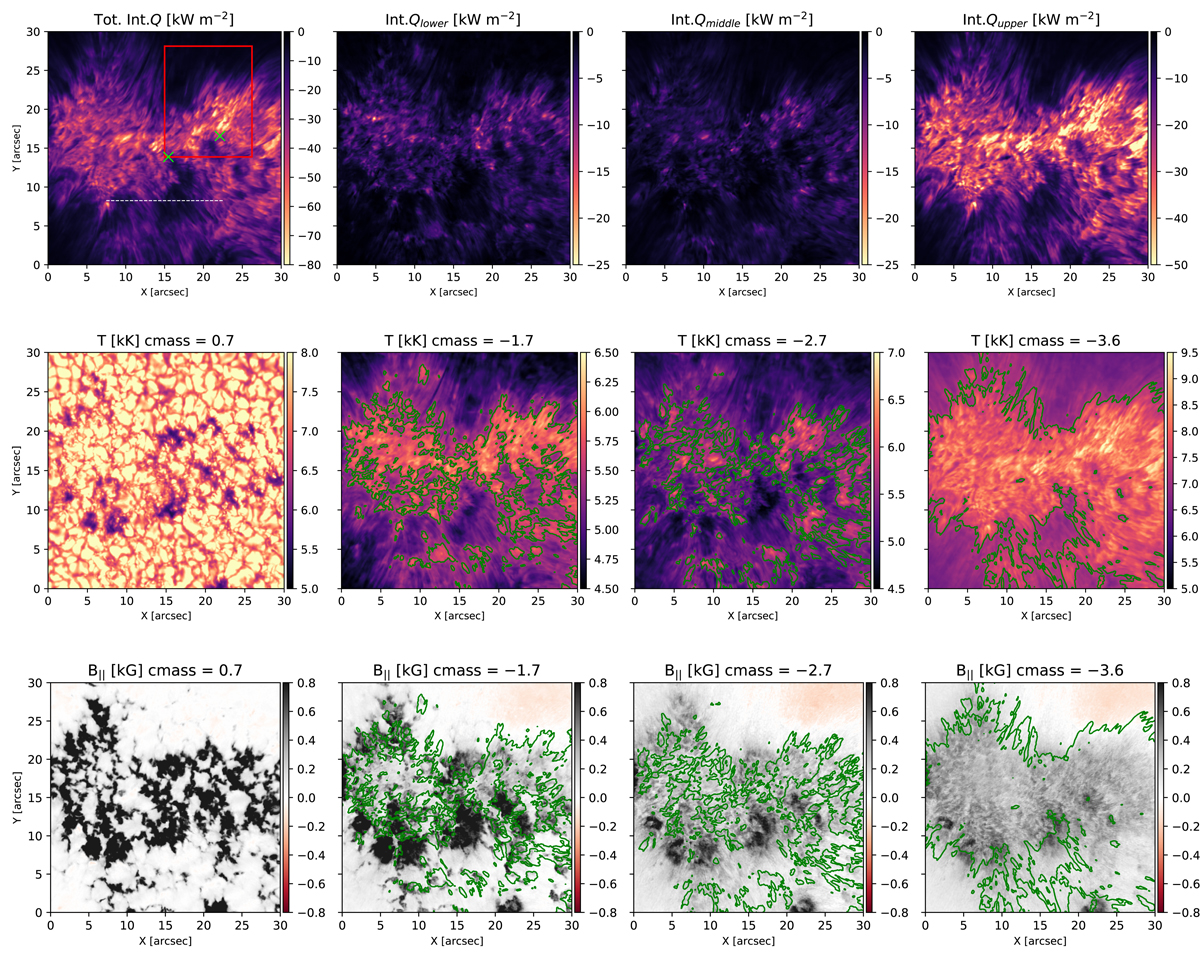
Maps of the radiative losses, temperature, and parallel magnetic field for different heights in the solar atmosphere. Top row: derived radiative losses for the entire FOV for the first time-step. The first panel from the left represents the total radiative losses integrated over the chromosphere. The other three panels show the radiative losses integrated over the lower, middle, and upper chromosphere, respectively. Middle row: maps of the temperature for four different heights in the solar atmosphere. The height increases from left to right. Bottom row: maps of the parallel magnetic field for four different heights in the solar atmosphere. The height is increasing from left to right. The first panels in the middle and bottom rows represent the T and B|| in the photosphere, respectively. The green contours indicate the area where ![]() kW m−2 in the corresponding atmosphere layer, where
kW m−2 in the corresponding atmosphere layer, where ![]() is the median value of Q in the corresponding layer. Const = 1.6 for the lower and middle chromosphere, and const = 0.7 for the upper layer.
is the median value of Q in the corresponding layer. Const = 1.6 for the lower and middle chromosphere, and const = 0.7 for the upper layer.
Current usage metrics show cumulative count of Article Views (full-text article views including HTML views, PDF and ePub downloads, according to the available data) and Abstracts Views on Vision4Press platform.
Data correspond to usage on the plateform after 2015. The current usage metrics is available 48-96 hours after online publication and is updated daily on week days.
Initial download of the metrics may take a while.