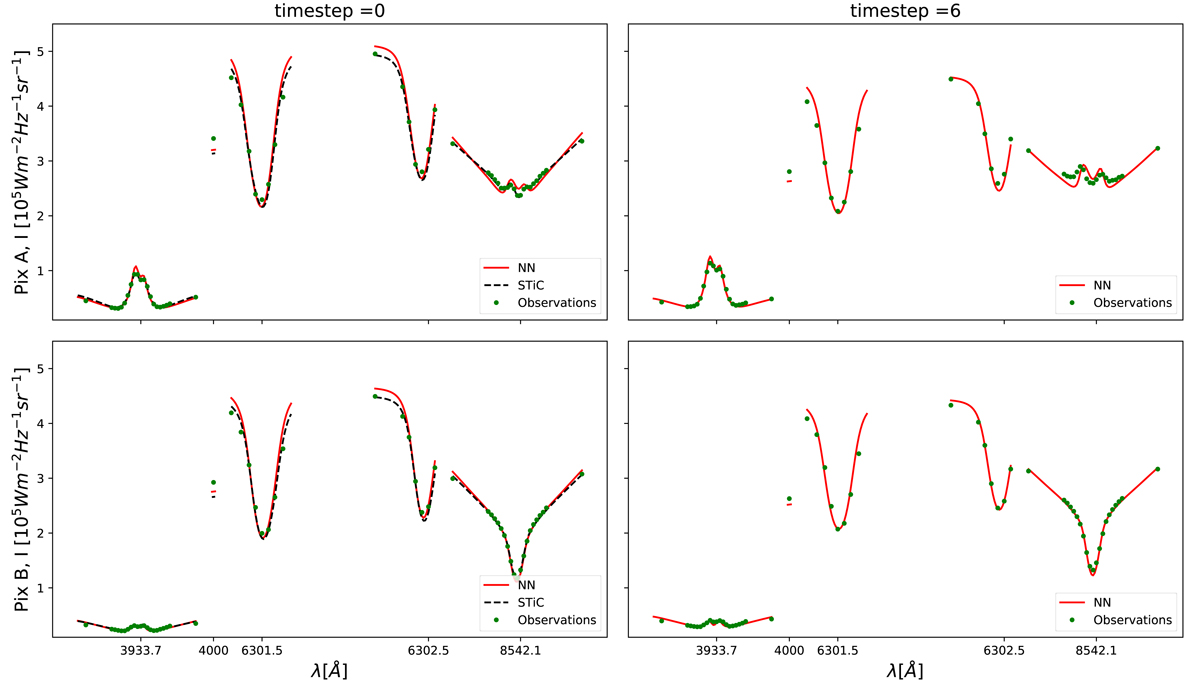
Fig. A.2.
Download original image
Comparison between spectra synthesized from the results of the NN (red lines), synthetic spectra from the inversion process (black dashed lines) and observed spectra (green dots) for two different time-steps. The synthetic spectra from the inversions were only calculated for the initial time-step. The two random pixels selected are indicated in the upper left panel of Fig. 11.
Current usage metrics show cumulative count of Article Views (full-text article views including HTML views, PDF and ePub downloads, according to the available data) and Abstracts Views on Vision4Press platform.
Data correspond to usage on the plateform after 2015. The current usage metrics is available 48-96 hours after online publication and is updated daily on week days.
Initial download of the metrics may take a while.