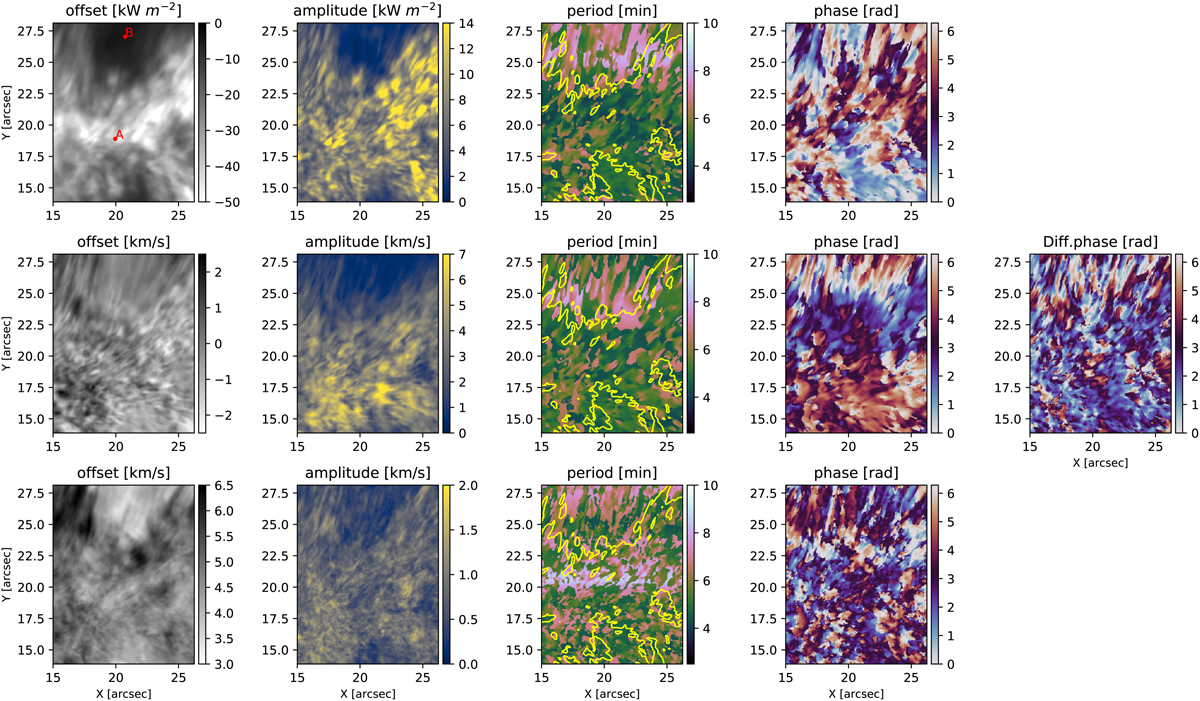
Fig. 11.
Download original image
Maps of the parameters (offset, amplitude, period, and phase) of the sinusoidal functions obtained for the red region of Fig. 7. Top row: quantities characterizing the sinusoidal time-evolution of the radiative losses, while the second row represents the quantities characterizing the time-evolution of vLOS at cmass = −3.8. In the maps of the period, yellow contours indicate the plage area corresponding to Q < −20 kW m−2 (see Fig. 7). The first column from the right shows the phase difference between Q and vLOS. Bottom row: quantities of the sinusoidal evolution for vturb at cmass = −3.8.
Current usage metrics show cumulative count of Article Views (full-text article views including HTML views, PDF and ePub downloads, according to the available data) and Abstracts Views on Vision4Press platform.
Data correspond to usage on the plateform after 2015. The current usage metrics is available 48-96 hours after online publication and is updated daily on week days.
Initial download of the metrics may take a while.