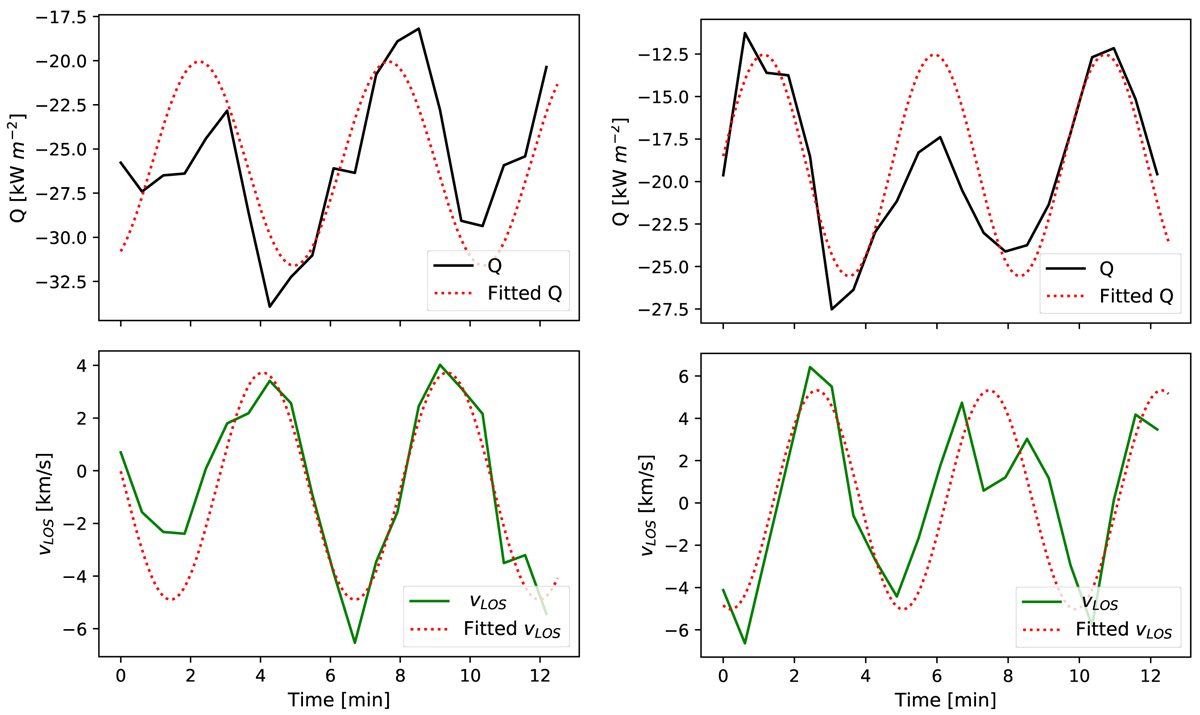
Fig. 10.
Download original image
Time-evolution of the radiative losses and of vLOS for two selected pixels and a region in the FOV. The two chosen pixels are indicated with green crosses in Fig. 7. Left: time-evolution of Q (top panel) and vLOS (bottom panel) for the first random pixel. Right: time-evolution of Q (top panel) and vLOS (bottom panel) for the second random pixel.
Current usage metrics show cumulative count of Article Views (full-text article views including HTML views, PDF and ePub downloads, according to the available data) and Abstracts Views on Vision4Press platform.
Data correspond to usage on the plateform after 2015. The current usage metrics is available 48-96 hours after online publication and is updated daily on week days.
Initial download of the metrics may take a while.