Fig. 4
Download original image
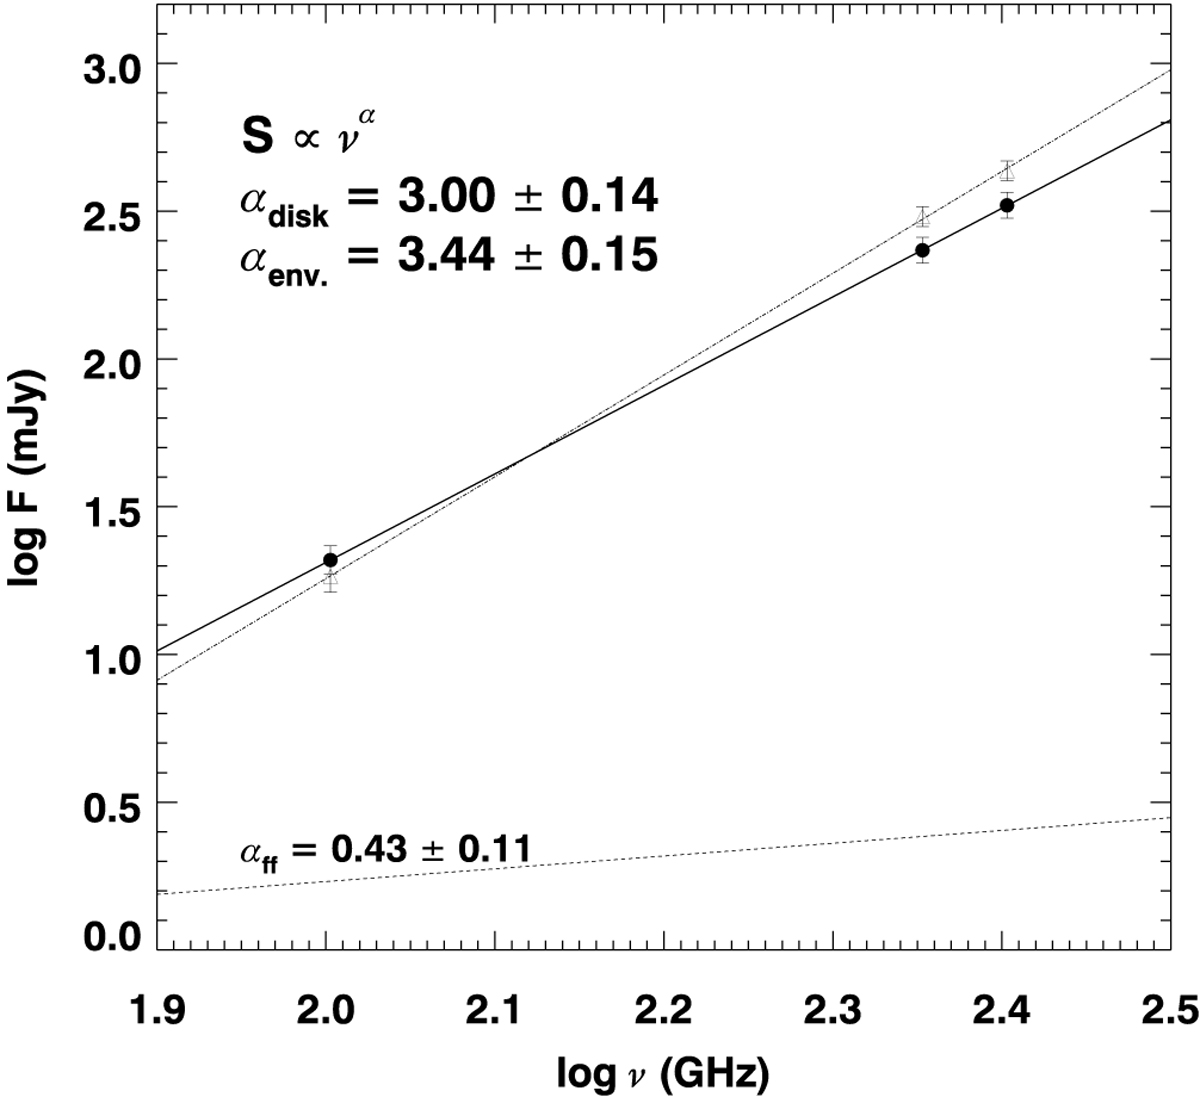
Spectral energy distribution determined for the dust emission within the circumbinary disc (α = 3.0, black line) and in the envelope (α = 3.4, dotted dashed line). The flux densities for the disc and envelope are indicated as filled circles and open triangles, respectively. The errors are dominated by the uncertainty in the flux calibration, which is assumed to be ~10%. The dashed line shows the SED determined from the free-free (centimetric) emission detected with the Very Large Array (Alves et al. 2019).
Current usage metrics show cumulative count of Article Views (full-text article views including HTML views, PDF and ePub downloads, according to the available data) and Abstracts Views on Vision4Press platform.
Data correspond to usage on the plateform after 2015. The current usage metrics is available 48-96 hours after online publication and is updated daily on week days.
Initial download of the metrics may take a while.