Open Access
Fig. 3
Download original image
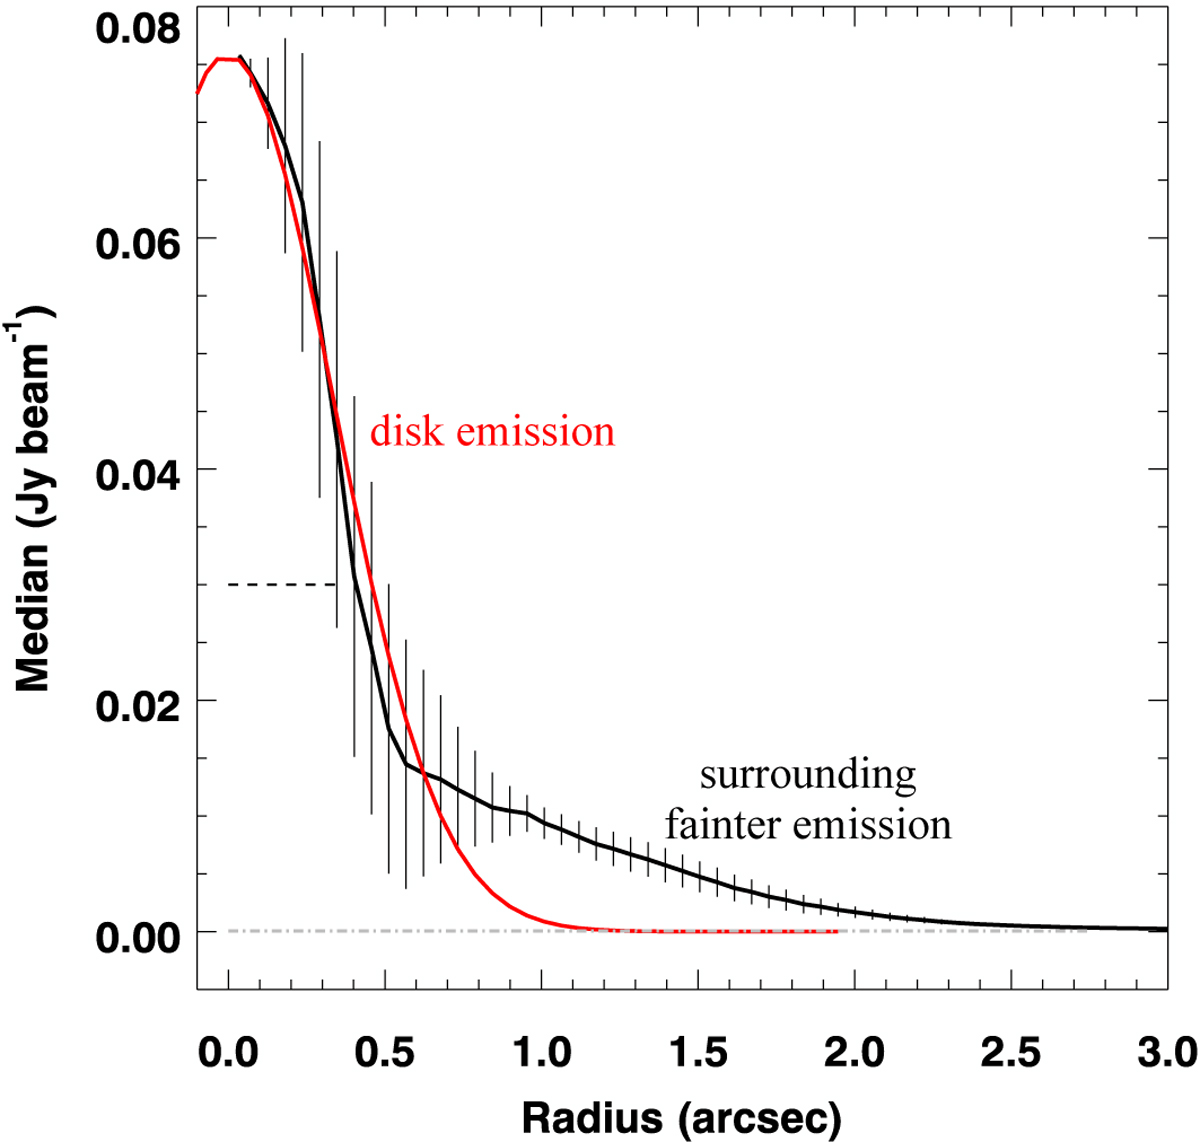
Radial profile of dust continuum emission at 252 GHz (setup 2) towards [BHB2007] 11. The profile is centred on the continuum peak. The red line shows a Gaussian fit to the disc’s brightness distribution. The dashed line indicates the synthesised beam size. The grey line shows the rms noise level of the continuum emission.
Current usage metrics show cumulative count of Article Views (full-text article views including HTML views, PDF and ePub downloads, according to the available data) and Abstracts Views on Vision4Press platform.
Data correspond to usage on the plateform after 2015. The current usage metrics is available 48-96 hours after online publication and is updated daily on week days.
Initial download of the metrics may take a while.