Fig. 19
Download original image
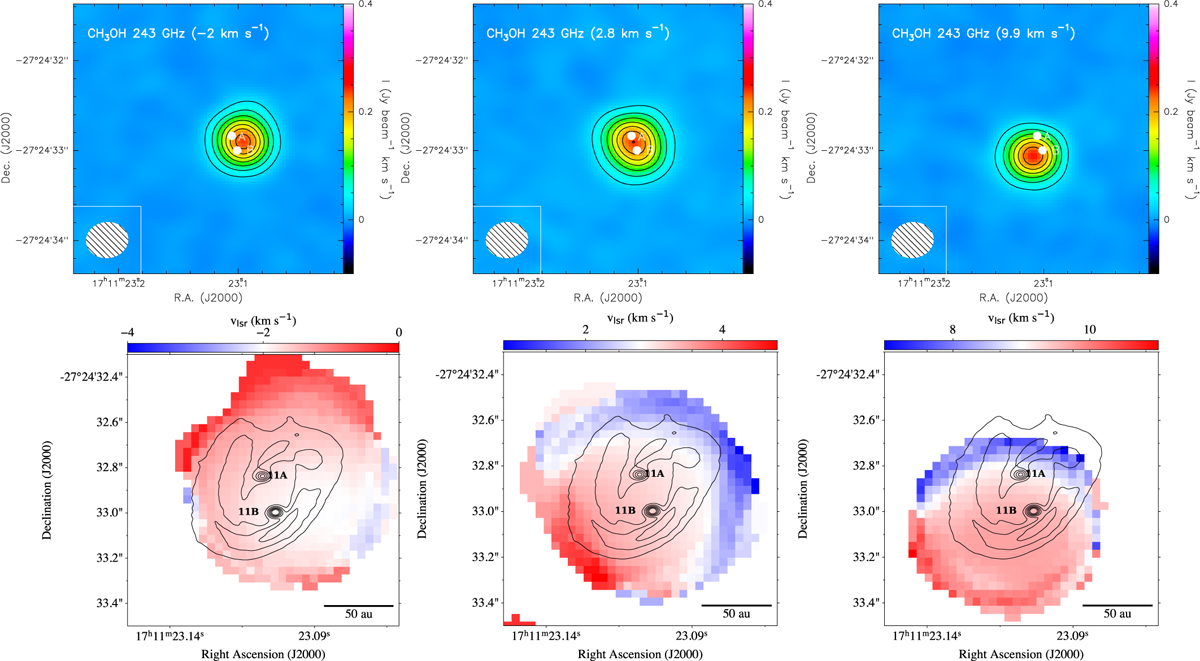
Moment 0 and moment 1 maps for the 51,4–41,3 transition of A-CH3OH. Top: integrated intensity maps of the high spectral resolution methanol transition at 243.916 GHz (Eu = 49.66 K) for the three components ([−7−0] km s−1 for the −2 km s−1 component, [0–6] km s−1 for the 2.8 km s−1 component, and [6-16] km s−1 for the 9.9 km s−1 component). Contours start at 4σ at every 4σ. The ellipse in the bottom left corner represents the ALMA synthesised beam. Both sources A and B identified by Alves et al. (2019) are indicated as white filled circles. Bottom: velocity field maps of the high spectral resolution methanol transition at 243.916 GHz (Eu = 49.66 K) for the three components.
Current usage metrics show cumulative count of Article Views (full-text article views including HTML views, PDF and ePub downloads, according to the available data) and Abstracts Views on Vision4Press platform.
Data correspond to usage on the plateform after 2015. The current usage metrics is available 48-96 hours after online publication and is updated daily on week days.
Initial download of the metrics may take a while.