Fig. 17
Download original image
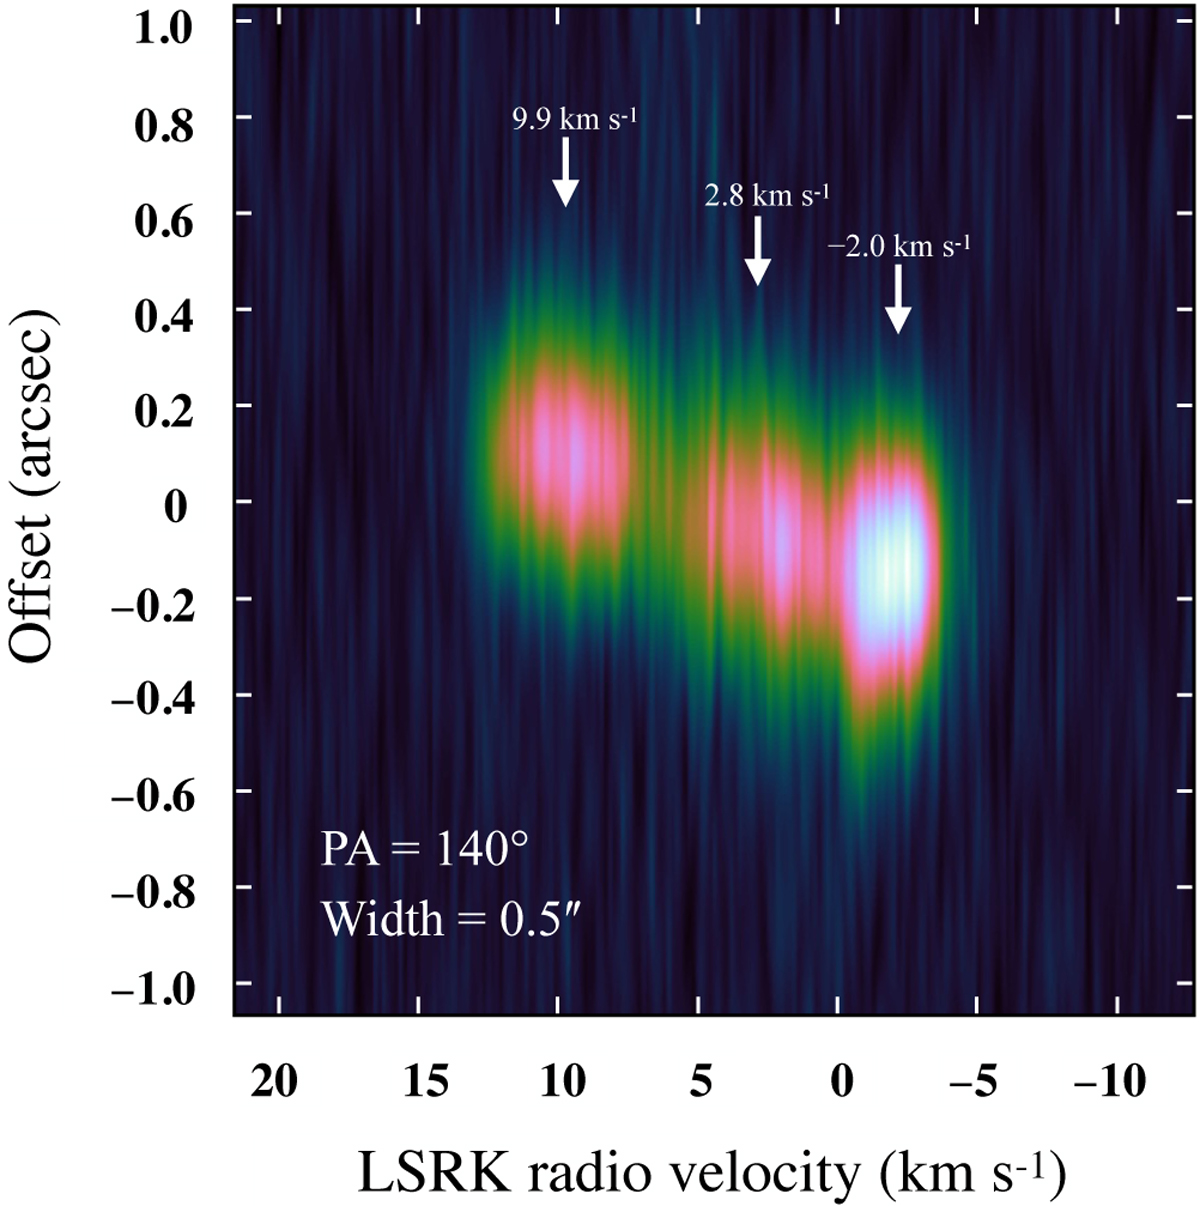
PV diagram obtained from the CH3OH emission at 243.916 GHz. The PA and width of the PV cut is indicated in the figure. We note that the direction of the cut used to produce the position-velocity diagram is shown in Fig. 10 as a grey dashed line. The three velocity components observed in the methanol spectra are also indicated.
Current usage metrics show cumulative count of Article Views (full-text article views including HTML views, PDF and ePub downloads, according to the available data) and Abstracts Views on Vision4Press platform.
Data correspond to usage on the plateform after 2015. The current usage metrics is available 48-96 hours after online publication and is updated daily on week days.
Initial download of the metrics may take a while.