Open Access
Fig. 13
Download original image
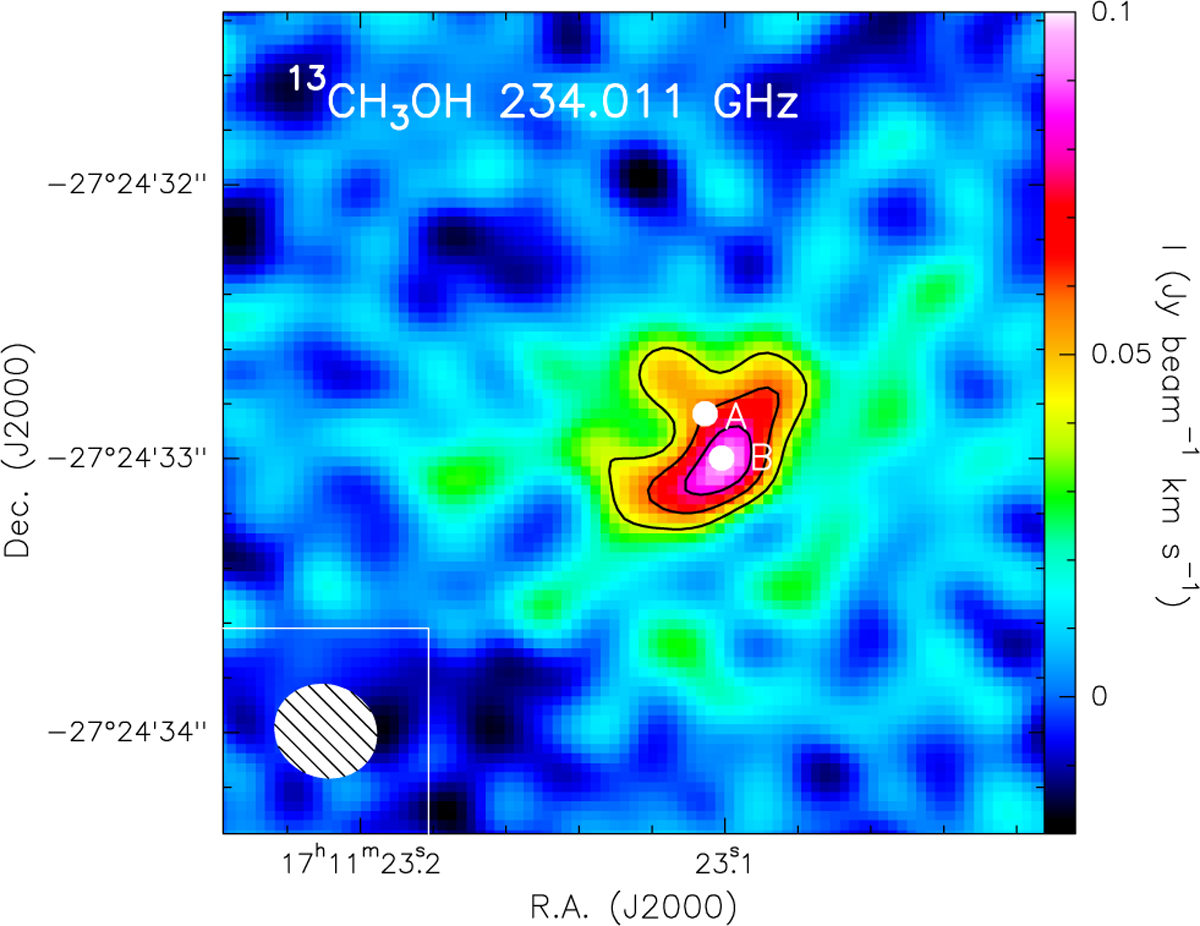
Moment 0 map of 13CH3OH transition at 234 GHz. Contours start at 4σ at every 2σ. The ellipse in the bottom left corner represents the ALMA synthesised beam. Both sources 11A and 11B identified by Alves et al. (2019) are indicated as white filled circles.
Current usage metrics show cumulative count of Article Views (full-text article views including HTML views, PDF and ePub downloads, according to the available data) and Abstracts Views on Vision4Press platform.
Data correspond to usage on the plateform after 2015. The current usage metrics is available 48-96 hours after online publication and is updated daily on week days.
Initial download of the metrics may take a while.