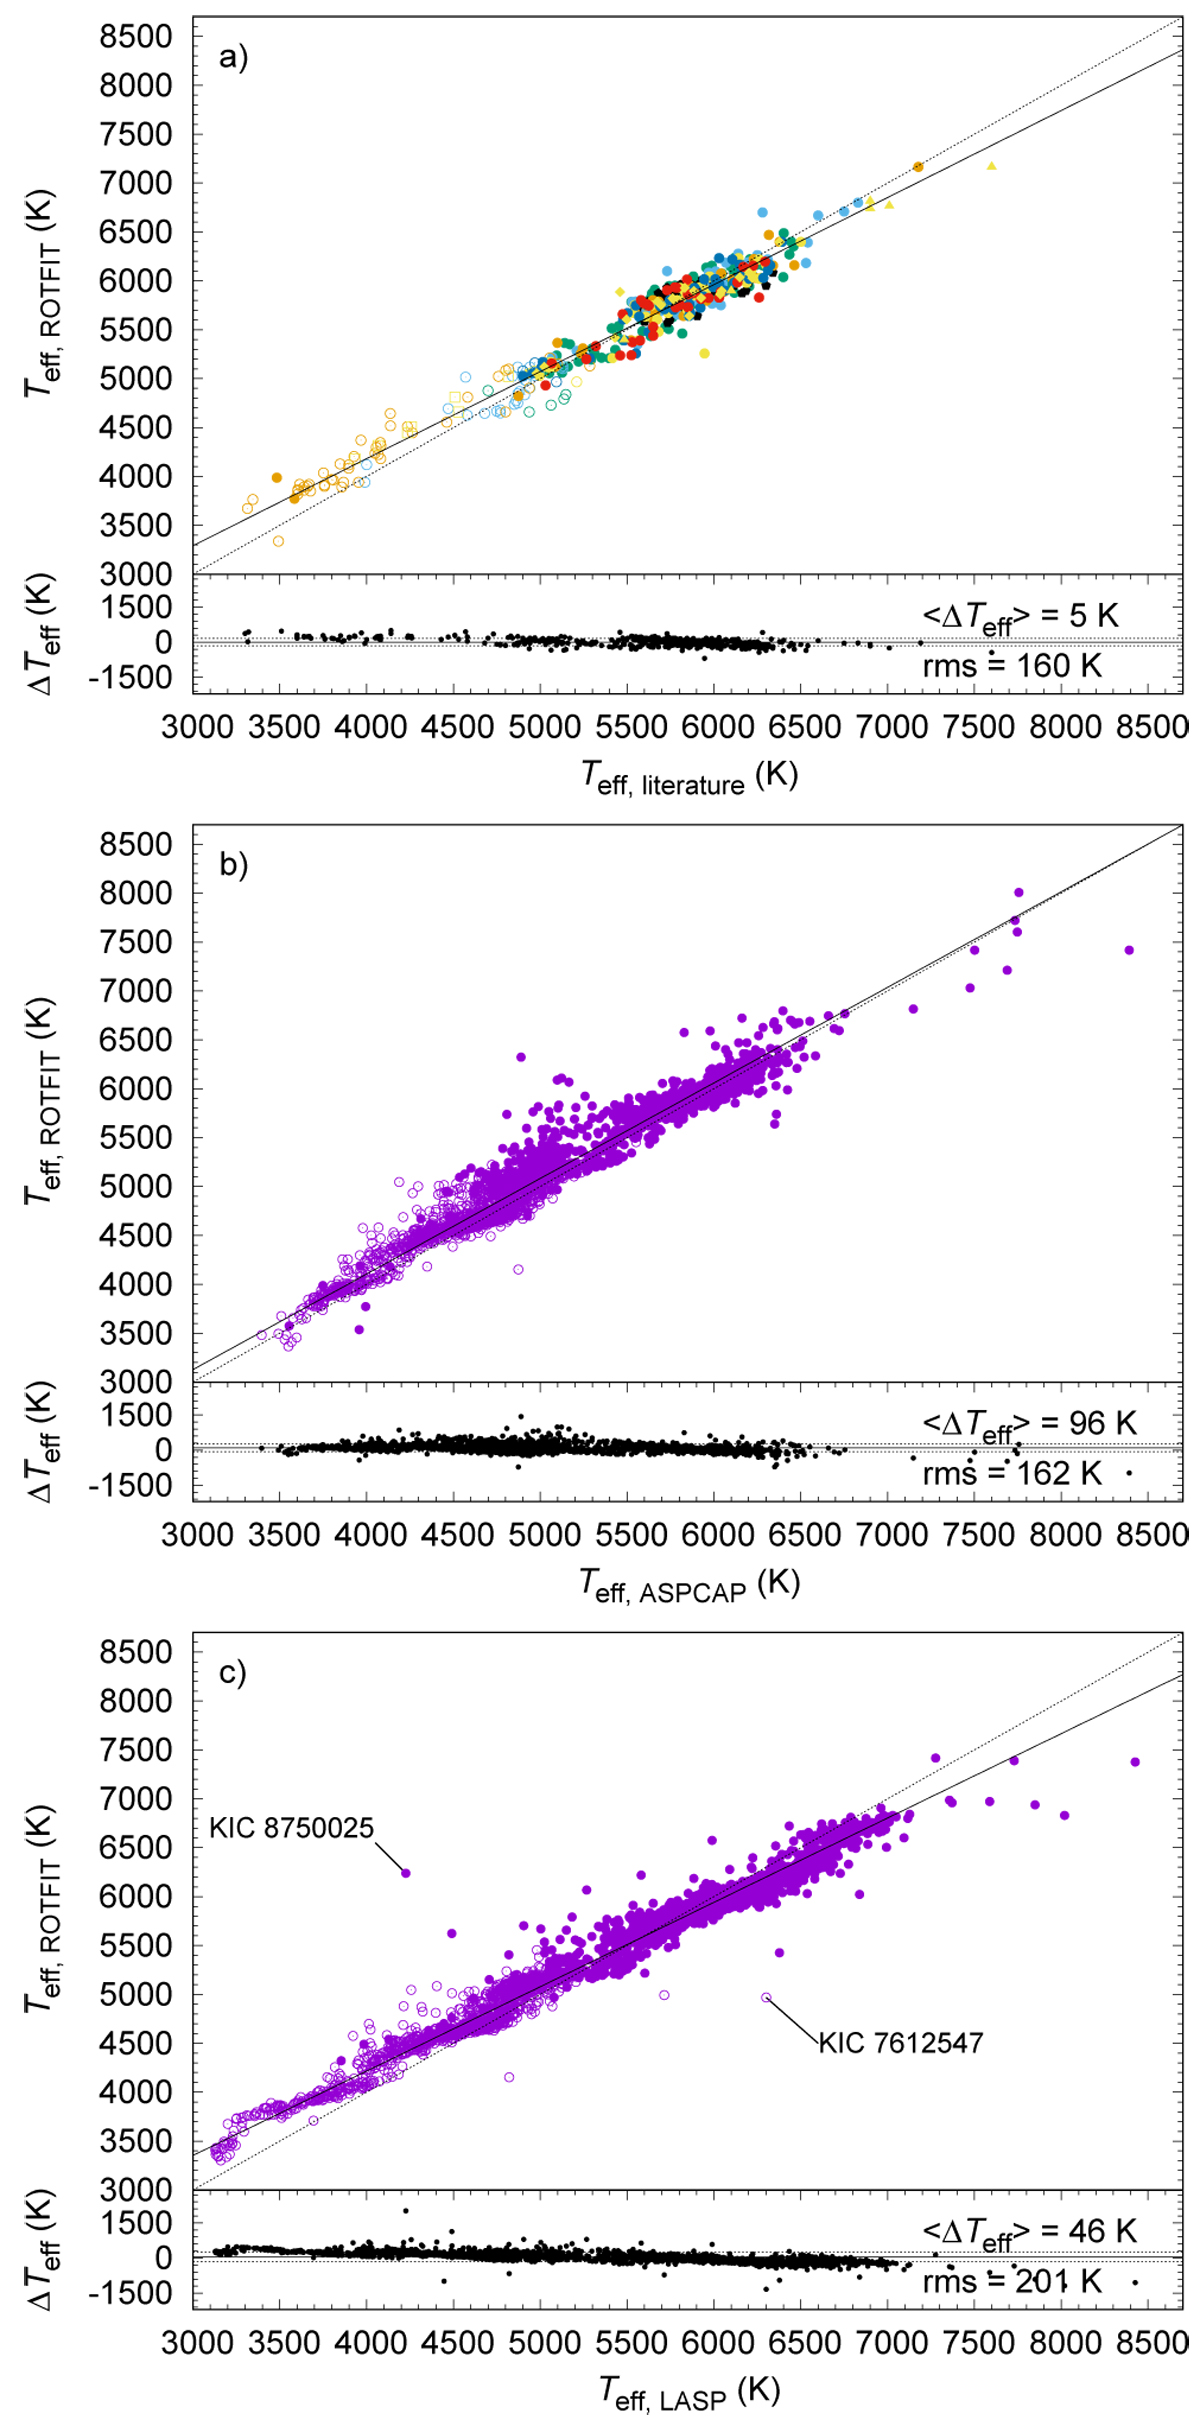
Fig. 7
Download original image
Comparison of Teff values. (a) Comparison between the values of effective temperature in our database of LAMOST spectra and in the literature. Filled symbols represent dwarfs (log gROTFIT ≥ 3.5), open symbols represent giants (log gROTFIT < 3.5). Different colors have been used for different literature sources, as indicated in the main text. The comparison with the APOGEE and LASP Teff is shown in the middle (b) and bottom (c) panels, respectively. The dotted lines in the top box of each panel represent one-to-one relationships. The solid lines are linear fits to the data. The differences between ROTFIT and literature parameters are shown in the lower parts of each panel along with their average values and standard deviations. Stars indicated with arrows are discussed in the text.
Current usage metrics show cumulative count of Article Views (full-text article views including HTML views, PDF and ePub downloads, according to the available data) and Abstracts Views on Vision4Press platform.
Data correspond to usage on the plateform after 2015. The current usage metrics is available 48-96 hours after online publication and is updated daily on week days.
Initial download of the metrics may take a while.