Fig. 6
Download original image
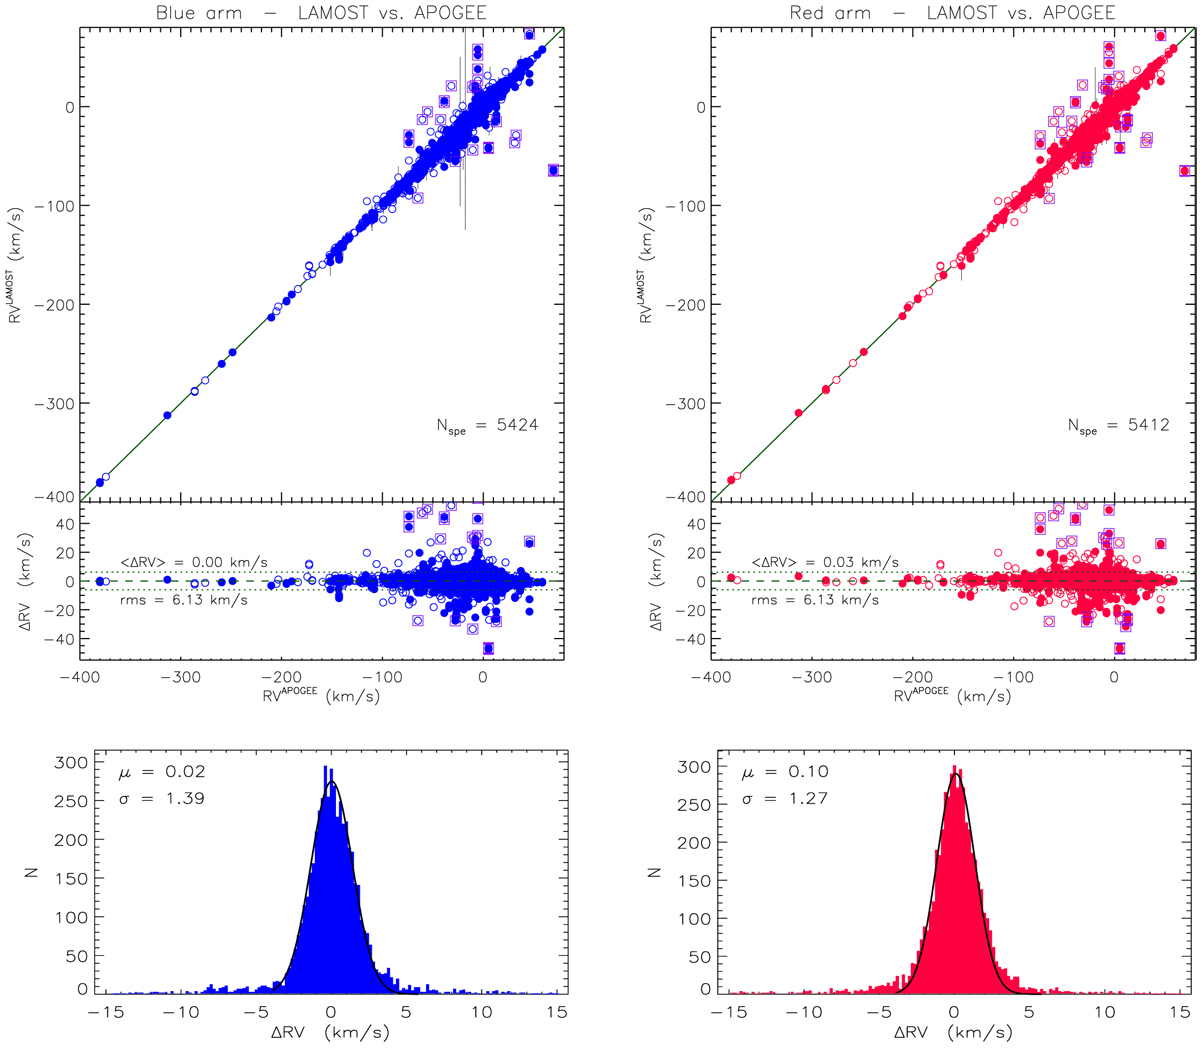
Comparison with the APOGEE RVs. Upper-left panel: comparison between the RV measured on the blue-arm LAMOST MRS (Table C.3) and APOGEE values (Jönsson et al. 2020). Filled symbols represent the stars with multiple spectra. The one-to-one relation is shown by the continuous line. The RV differences between LAMOST and APOGEE, ∆RV, are displayed in the lower box and show an average value of 0.0 km s−1 (dashed line) and a standard deviation of 6.1 km s−1 (dotted lines). Upper-right panel: same as the upper-left panel but for the red-arm RVs listed in Table C.2. The purple squares in both panels enclose the more discrepant points (more than four times the rms). The distributions of the RV differences are shown by the histograms in the lower panels. The Gaussian fits are overplotted with black lines, and the center (μ) and dispersion (σ) of the Gaussians are also marked in these boxes.
Current usage metrics show cumulative count of Article Views (full-text article views including HTML views, PDF and ePub downloads, according to the available data) and Abstracts Views on Vision4Press platform.
Data correspond to usage on the plateform after 2015. The current usage metrics is available 48-96 hours after online publication and is updated daily on week days.
Initial download of the metrics may take a while.