Open Access
Figure D.3
Download original image
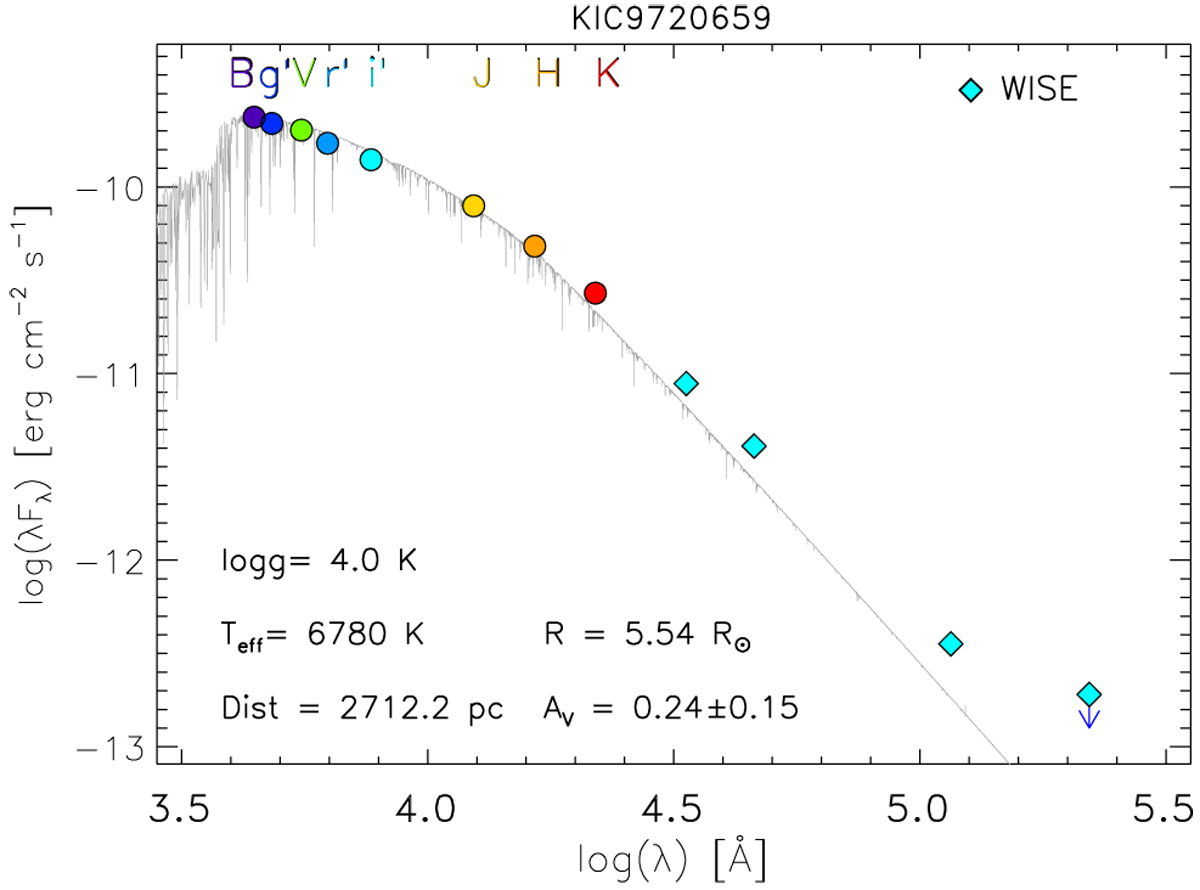
Spectral energy distribution of the possible Herbig star KIC 9720659 from the optical/near-infrared (colored dots) to the mid-infrared bands (diamonds). The BT-Settl spectrum (Allard et al. 2012) that provides the best fit to the star photosphere up to the J band is shown with a gray line.
Current usage metrics show cumulative count of Article Views (full-text article views including HTML views, PDF and ePub downloads, according to the available data) and Abstracts Views on Vision4Press platform.
Data correspond to usage on the plateform after 2015. The current usage metrics is available 48-96 hours after online publication and is updated daily on week days.
Initial download of the metrics may take a while.