Figure C.6
Download original image
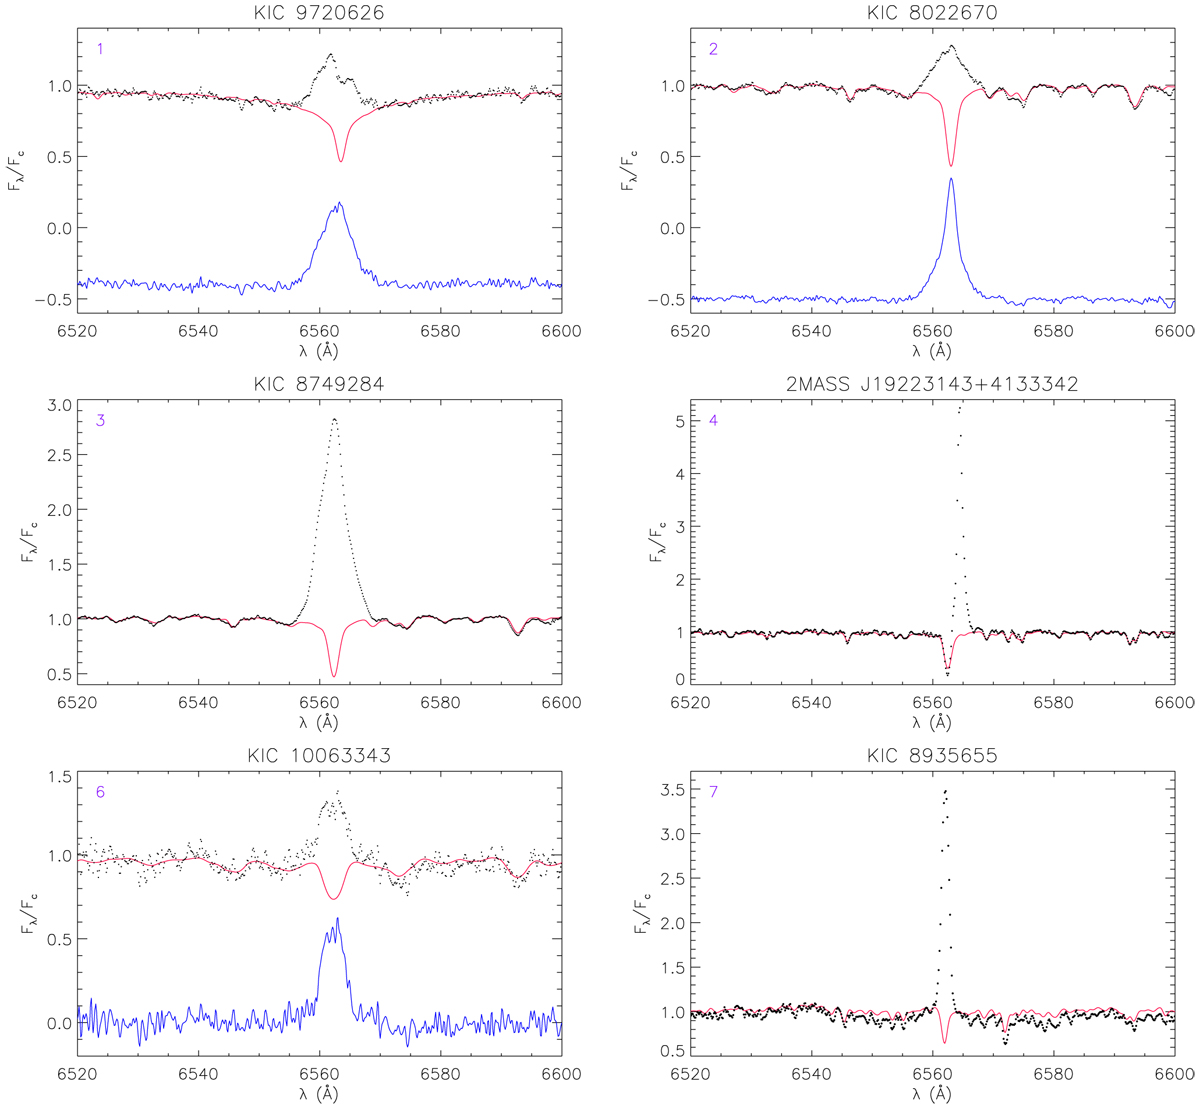
Observed continuum-normalized spectra of the stars with the strongest Hα flux (black dots), labeled according to Fig. 11. The best fitting template is overlaid with a red line. The differences observed – template are displayed in the bottom of the boxes, with blue lines for the stars with moderate emission. The Hα profile of star #5 is displayed in Fig. 10.
Current usage metrics show cumulative count of Article Views (full-text article views including HTML views, PDF and ePub downloads, according to the available data) and Abstracts Views on Vision4Press platform.
Data correspond to usage on the plateform after 2015. The current usage metrics is available 48-96 hours after online publication and is updated daily on week days.
Initial download of the metrics may take a while.