Figure C.3
Download original image
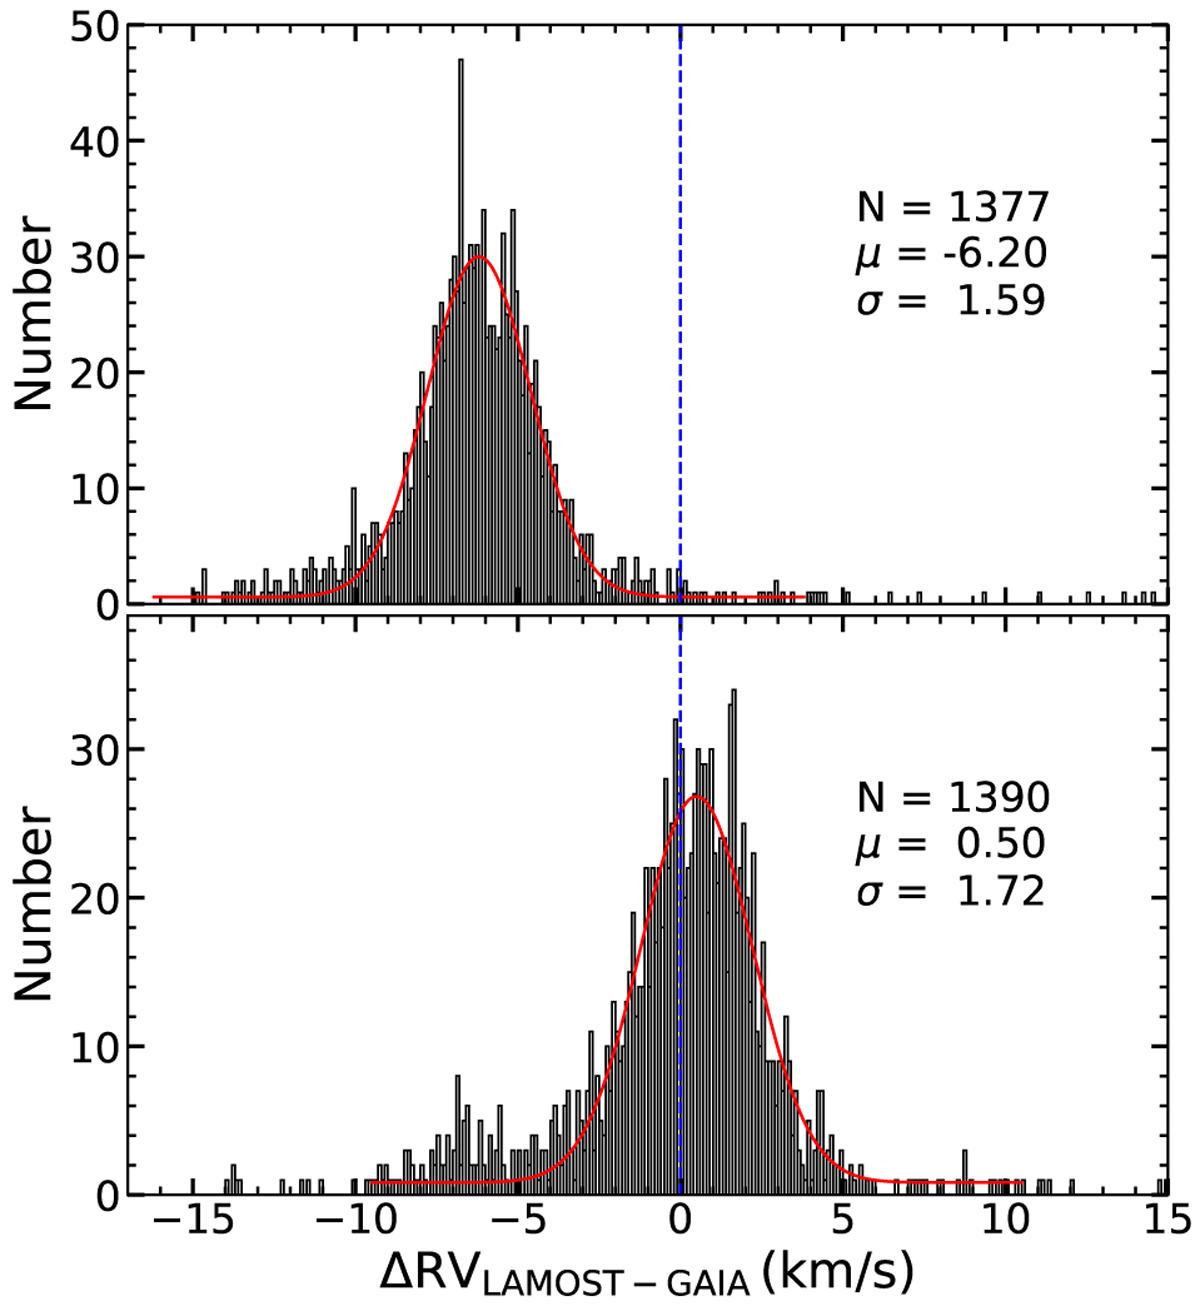
Radial velocity difference of LK–MRS to Gaia (black histograms) for two plates calibrated with different lamps in the blue arm (top: 58267-HIPP95119KP01; bottom: 58263-HIP9511901). Red lines represent the best Gaussian fittings, whose centers and widths, μ and σ, are quoted in the legend. The vertical dotted blue line marks ∆RV=0.
Current usage metrics show cumulative count of Article Views (full-text article views including HTML views, PDF and ePub downloads, according to the available data) and Abstracts Views on Vision4Press platform.
Data correspond to usage on the plateform after 2015. The current usage metrics is available 48-96 hours after online publication and is updated daily on week days.
Initial download of the metrics may take a while.