Open Access
Figure B.1
Download original image
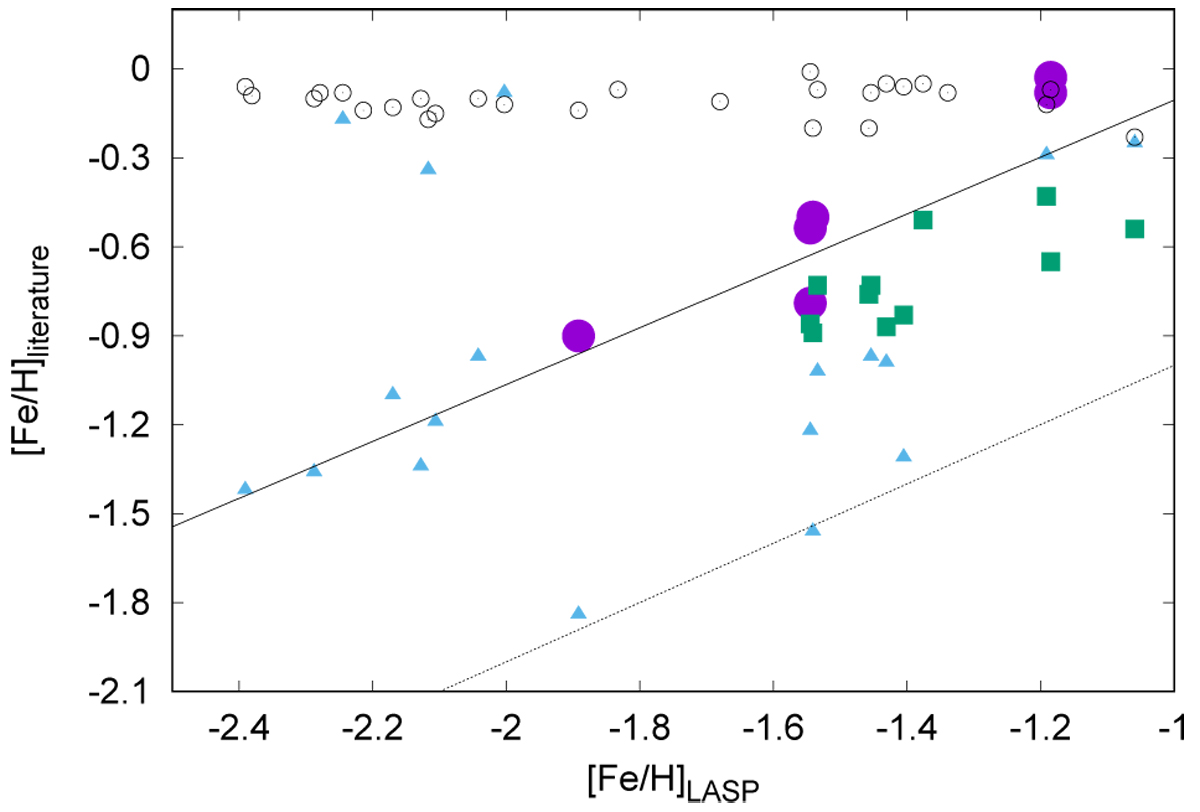
Comparison of the [Fe/H] values derived by Zong et al. (2020) with the values reported in the literature. Different colors and symbols are used for different literature sources, as indicated in the text. The solid line is a linear fit to the data. The dotted line represents the one-to-one relationship.
Current usage metrics show cumulative count of Article Views (full-text article views including HTML views, PDF and ePub downloads, according to the available data) and Abstracts Views on Vision4Press platform.
Data correspond to usage on the plateform after 2015. The current usage metrics is available 48-96 hours after online publication and is updated daily on week days.
Initial download of the metrics may take a while.