Fig. 20
Download original image
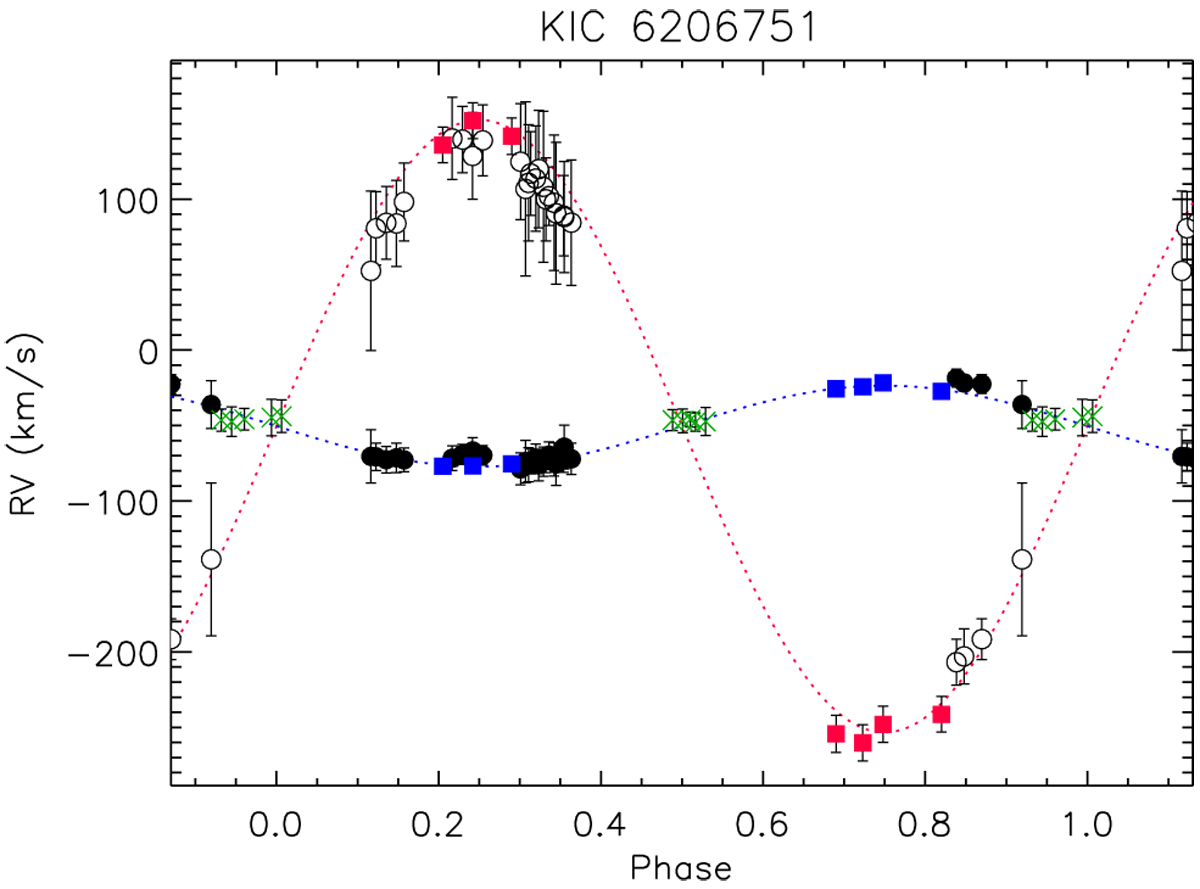
Radial velocity curve of KIC 6206751. The RV data from Matson et al. (2017) are displayed with blue and red squares and the orbital solution with dotted blue and red lines for the primary and secondary component, respectively. The LAMOST MRS RVs derived in this work are overplotted with filled black circles for the primary and open black circles for the secondary component. The green x symbols display the RV values measured by us near the conjunctions, where a single peak is visible in the CCF.
Current usage metrics show cumulative count of Article Views (full-text article views including HTML views, PDF and ePub downloads, according to the available data) and Abstracts Views on Vision4Press platform.
Data correspond to usage on the plateform after 2015. The current usage metrics is available 48-96 hours after online publication and is updated daily on week days.
Initial download of the metrics may take a while.