Open Access
Fig. 15
Download original image
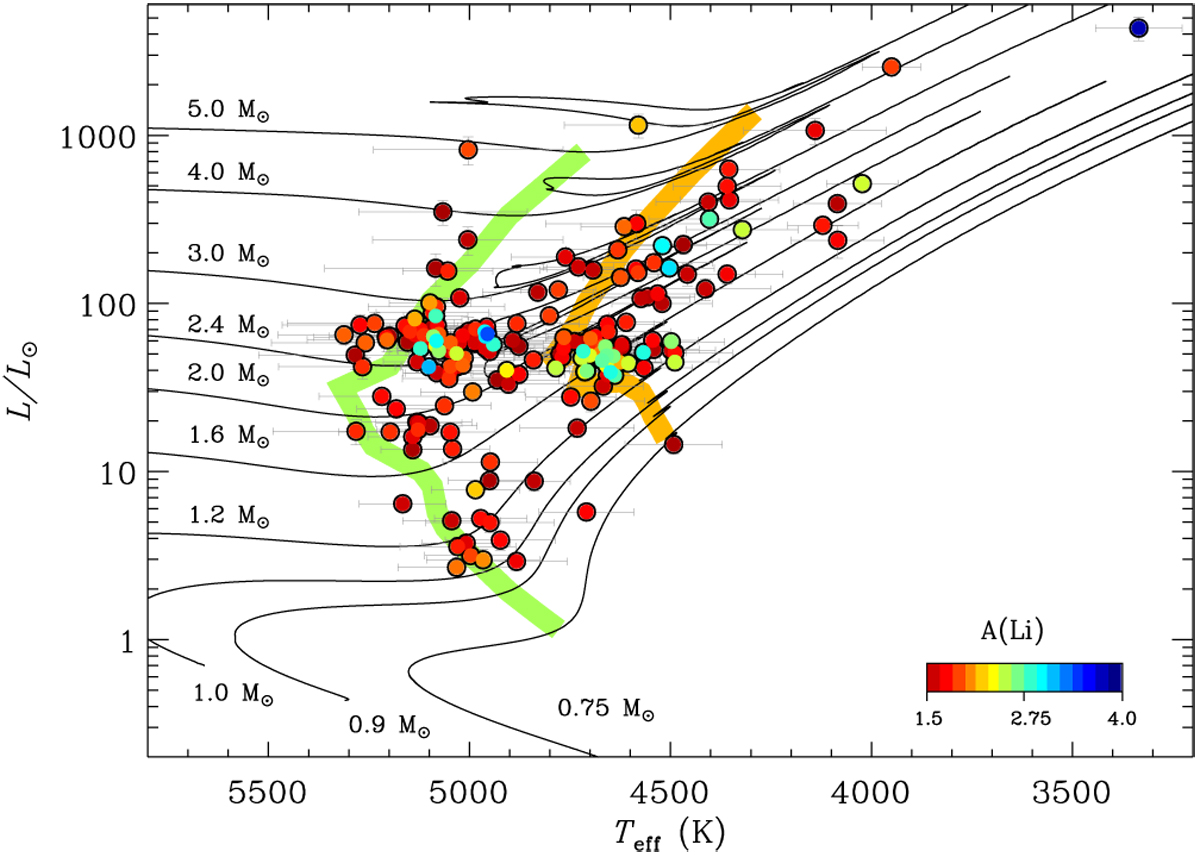
Hertzsprung-Russell diagram for all the Li-rich giants. The symbols are color coded by the lithium abundance A(Li). The PARSEC post-MS evolutionary tracks (Bressan et al. 2012) for a metallicity Z = 0.017 are plotted with black lines. The green and orange strips mark the base of the RGB and the RGB bump, respectively.
Current usage metrics show cumulative count of Article Views (full-text article views including HTML views, PDF and ePub downloads, according to the available data) and Abstracts Views on Vision4Press platform.
Data correspond to usage on the plateform after 2015. The current usage metrics is available 48-96 hours after online publication and is updated daily on week days.
Initial download of the metrics may take a while.