Fig. 11
Download original image
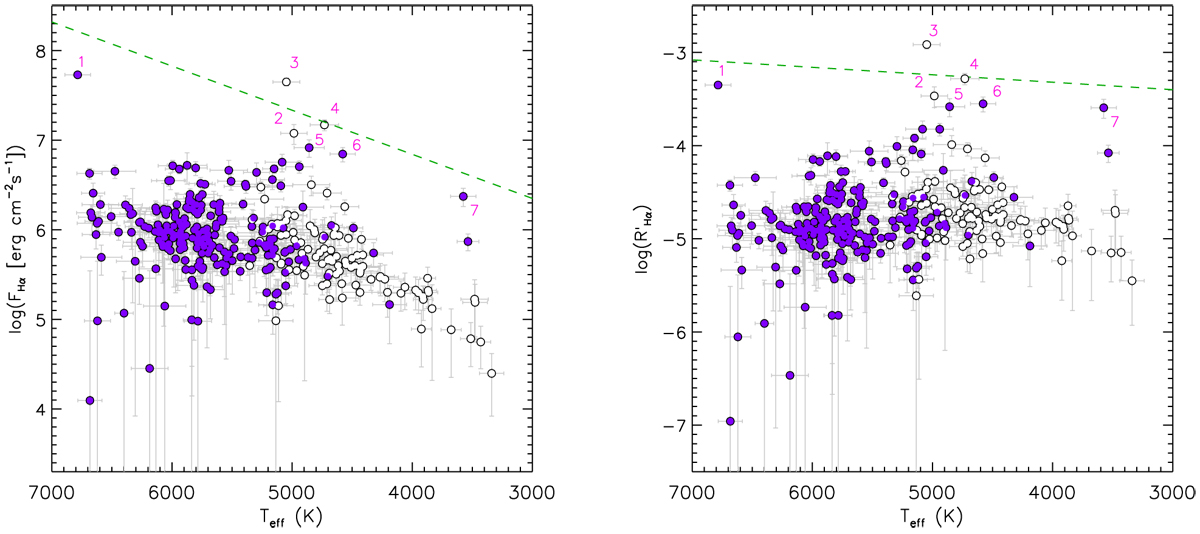
Activity indicators. Left panel: Hα flux versus Teff (open circles for giants, purple dots for MS stars). Right panel: ![]() versus Teff (same symbols). The straight dashed line in each panel is the boundary between chromospheric emission (below) and accretion as derived by Frasca et al. (2015). The objects with a flux close to this boundary are labeled with integer numbers and are discussed briefly in the text.
versus Teff (same symbols). The straight dashed line in each panel is the boundary between chromospheric emission (below) and accretion as derived by Frasca et al. (2015). The objects with a flux close to this boundary are labeled with integer numbers and are discussed briefly in the text.
Current usage metrics show cumulative count of Article Views (full-text article views including HTML views, PDF and ePub downloads, according to the available data) and Abstracts Views on Vision4Press platform.
Data correspond to usage on the plateform after 2015. The current usage metrics is available 48-96 hours after online publication and is updated daily on week days.
Initial download of the metrics may take a while.