Fig. 6.

Download original image
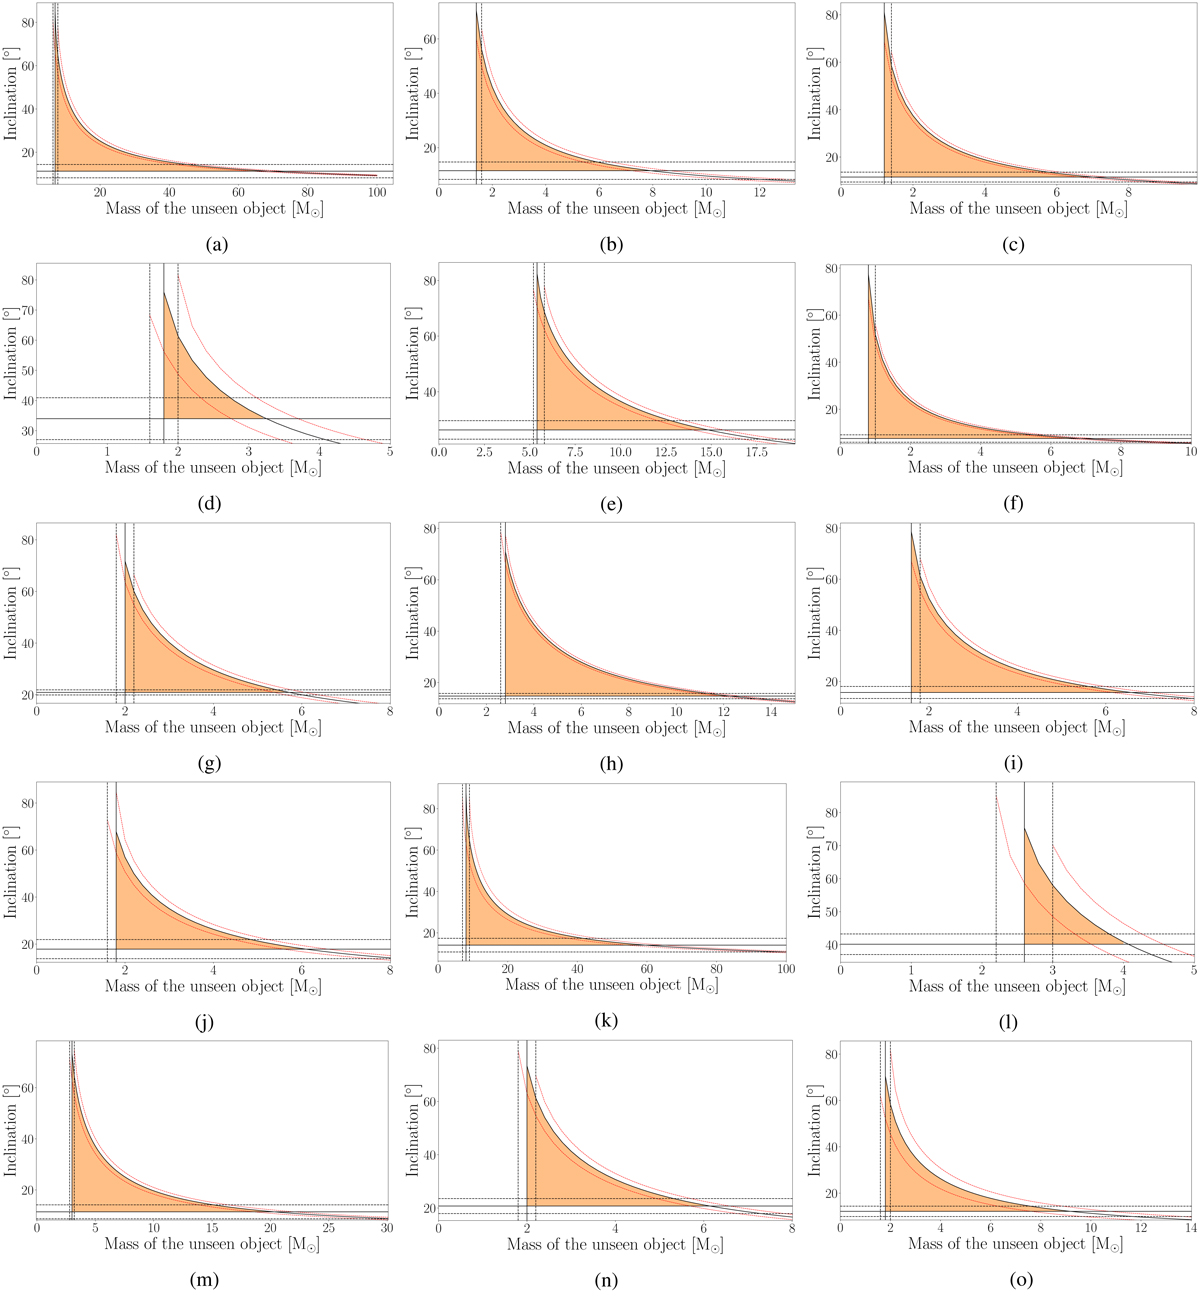
Inclinations as a function of the secondary mass for all the SB1 systems, where no spectroscopic signatures of the secondaries were found. These diagrams were computed using the evolutionary masses and the radii estimated with BONNSAI. The vertical solid line indicates the minimum masses of the unseen companions, and the dashed lines show the error bars on those values. The horizontal solid line indicates the minimum inclination of the systems, and the horizontal dashed lines show the error bars on the minimum inclinations. The orange shaded regions correspond to the possible values for the system inclinations and masses of the unseen objects. The dashed red lines indicate the error bars on the binary mass function and are computed by propagating the 1σ errors on the other parameters. (a) Cyg X-1. (b) HD 12323. (c) HD 14633. (d) HD 15137. (e) HD 37737. (f) HD 46573. (g) HD 74194. (h) HD 75211. (i) HD 94024. (j) HD 105627. (k) HD 130298. (l) HD 165174. (m) HD 229234. (n) HD 308813. (o) LS 5039.
Current usage metrics show cumulative count of Article Views (full-text article views including HTML views, PDF and ePub downloads, according to the available data) and Abstracts Views on Vision4Press platform.
Data correspond to usage on the plateform after 2015. The current usage metrics is available 48-96 hours after online publication and is updated daily on week days.
Initial download of the metrics may take a while.


