Fig. 3.
Download original image
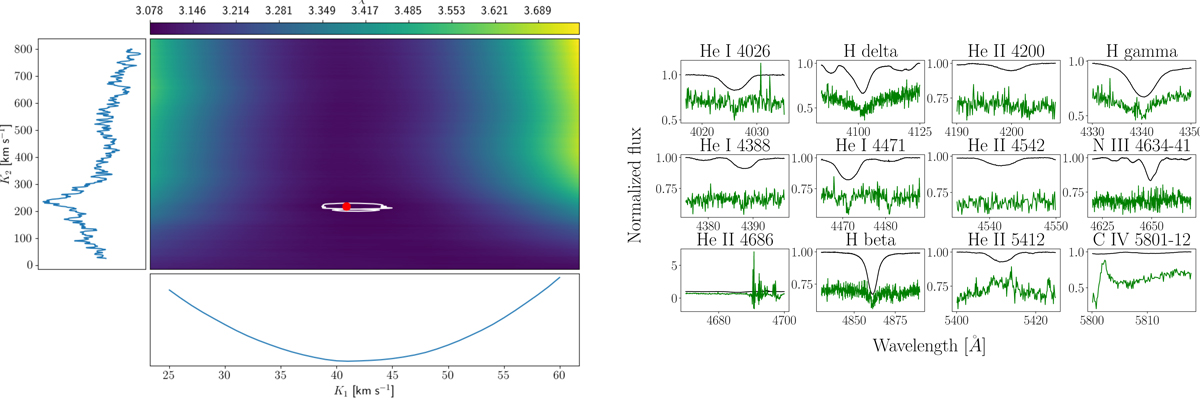
Left: reduced χ2 map given by the grid disentangling for HD 163892 by combining the He I 4471, Mg II 4481 and Hγ lines. The minimal reduced χ2, at K1 = 41.05 ± 2.50 km s−1, K2 = 232.5 ± 14.9 km s−1 is shown with a red dot. The solid white lines represent the 1σ contours. The 1D cuts in both directions are given as indications. Right: disentangled spectra of the primary (black) and secondary (green) of HD 163892. The latter has been shifted vertically by −0.25 for clarity.
Current usage metrics show cumulative count of Article Views (full-text article views including HTML views, PDF and ePub downloads, according to the available data) and Abstracts Views on Vision4Press platform.
Data correspond to usage on the plateform after 2015. The current usage metrics is available 48-96 hours after online publication and is updated daily on week days.
Initial download of the metrics may take a while.