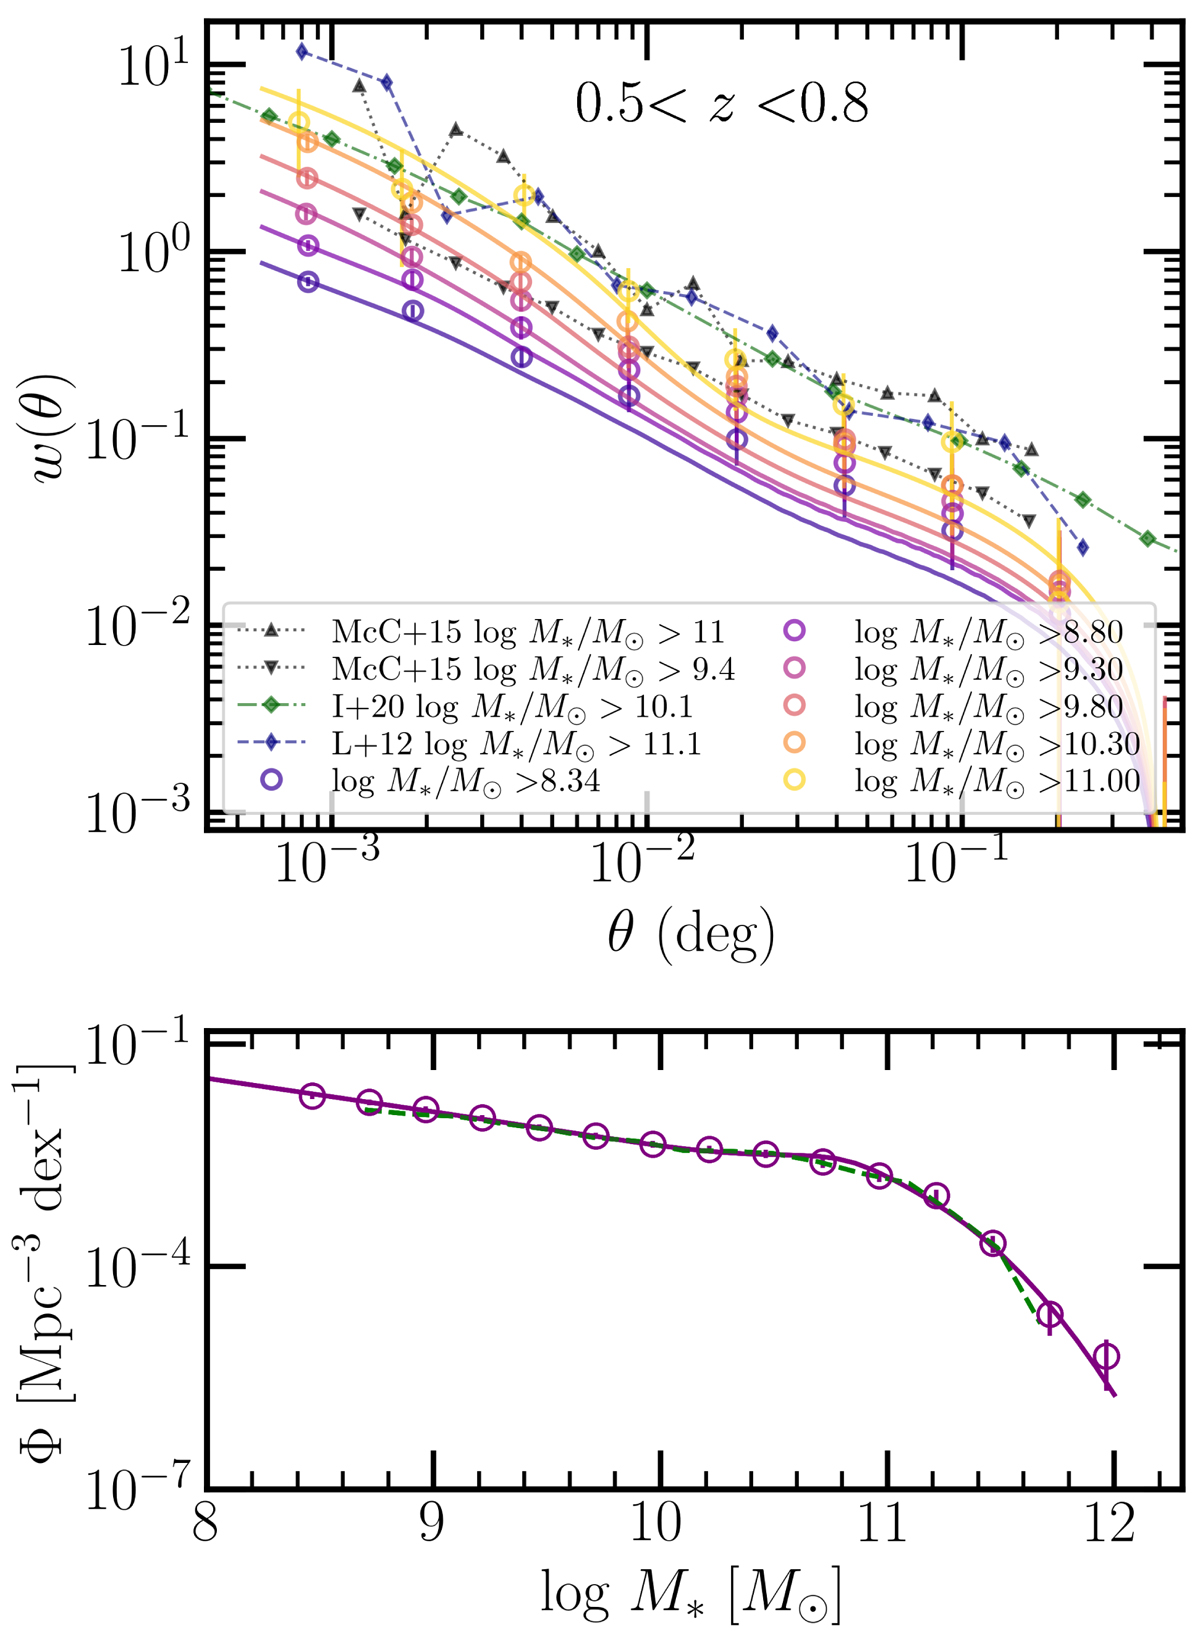
Fig. 3.
Download original image
Best-fit models for clustering and abundance compared with measurements at 0.5 < z < 0.8. Top: clustering measurements for the 6 mass threshold-selected samples (empty circles with errorbars) along with the best-fit models in solid lines in corresponding colors. Bottom: measurements of the stellar mass function together with the best fit model. The dashed lines show the SMF in the same redshift bin obtained by Davidzon et al. (2017) for comparison.
Current usage metrics show cumulative count of Article Views (full-text article views including HTML views, PDF and ePub downloads, according to the available data) and Abstracts Views on Vision4Press platform.
Data correspond to usage on the plateform after 2015. The current usage metrics is available 48-96 hours after online publication and is updated daily on week days.
Initial download of the metrics may take a while.