Open Access
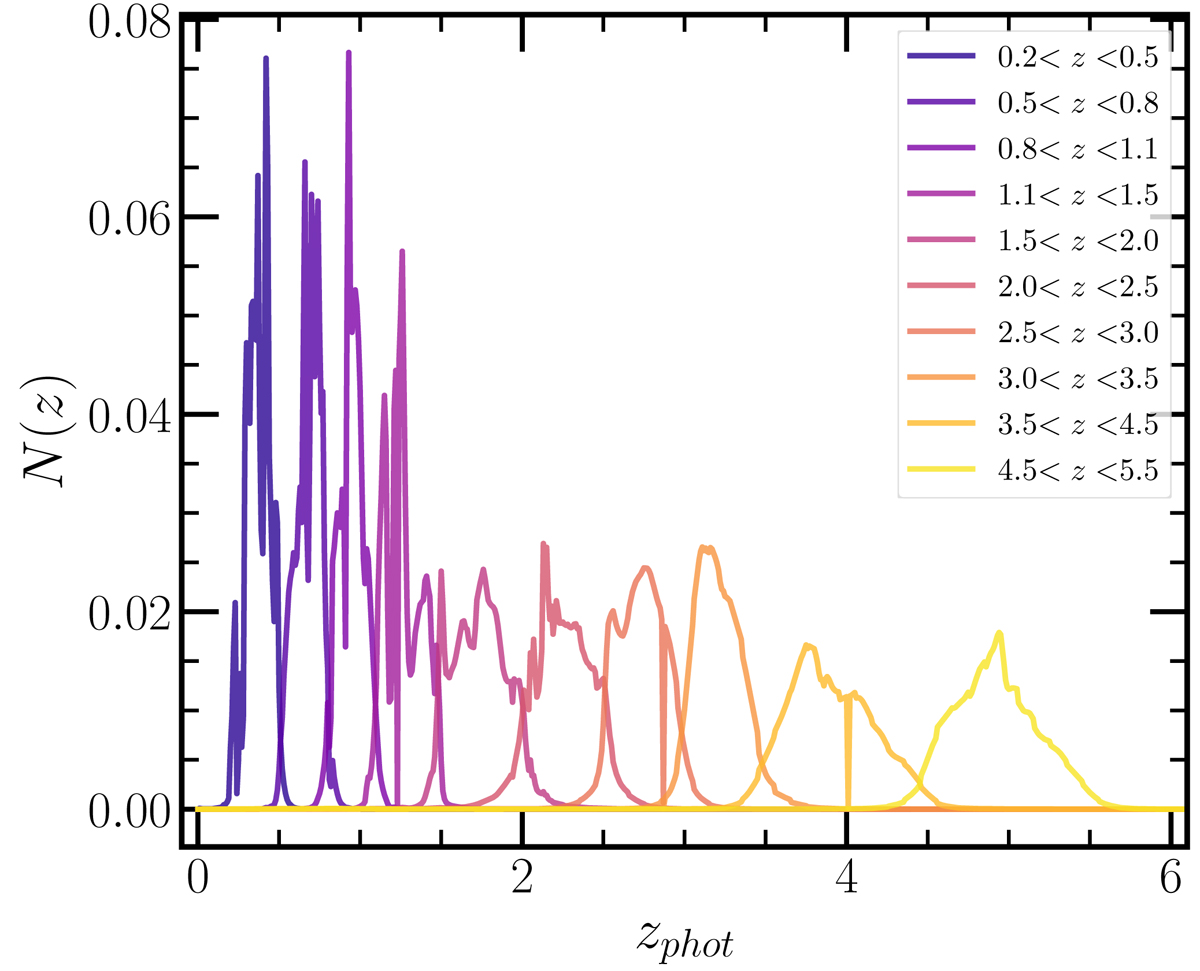
Fig. 2.
Download original image
Redshift distribution of the ten galaxy samples used for the clustering and abundance measurements. The redshift distribution is obtained by stacking the posterior photo-z distributions for all the sources in a given bin as described in Sect. 2.2.
Current usage metrics show cumulative count of Article Views (full-text article views including HTML views, PDF and ePub downloads, according to the available data) and Abstracts Views on Vision4Press platform.
Data correspond to usage on the plateform after 2015. The current usage metrics is available 48-96 hours after online publication and is updated daily on week days.
Initial download of the metrics may take a while.