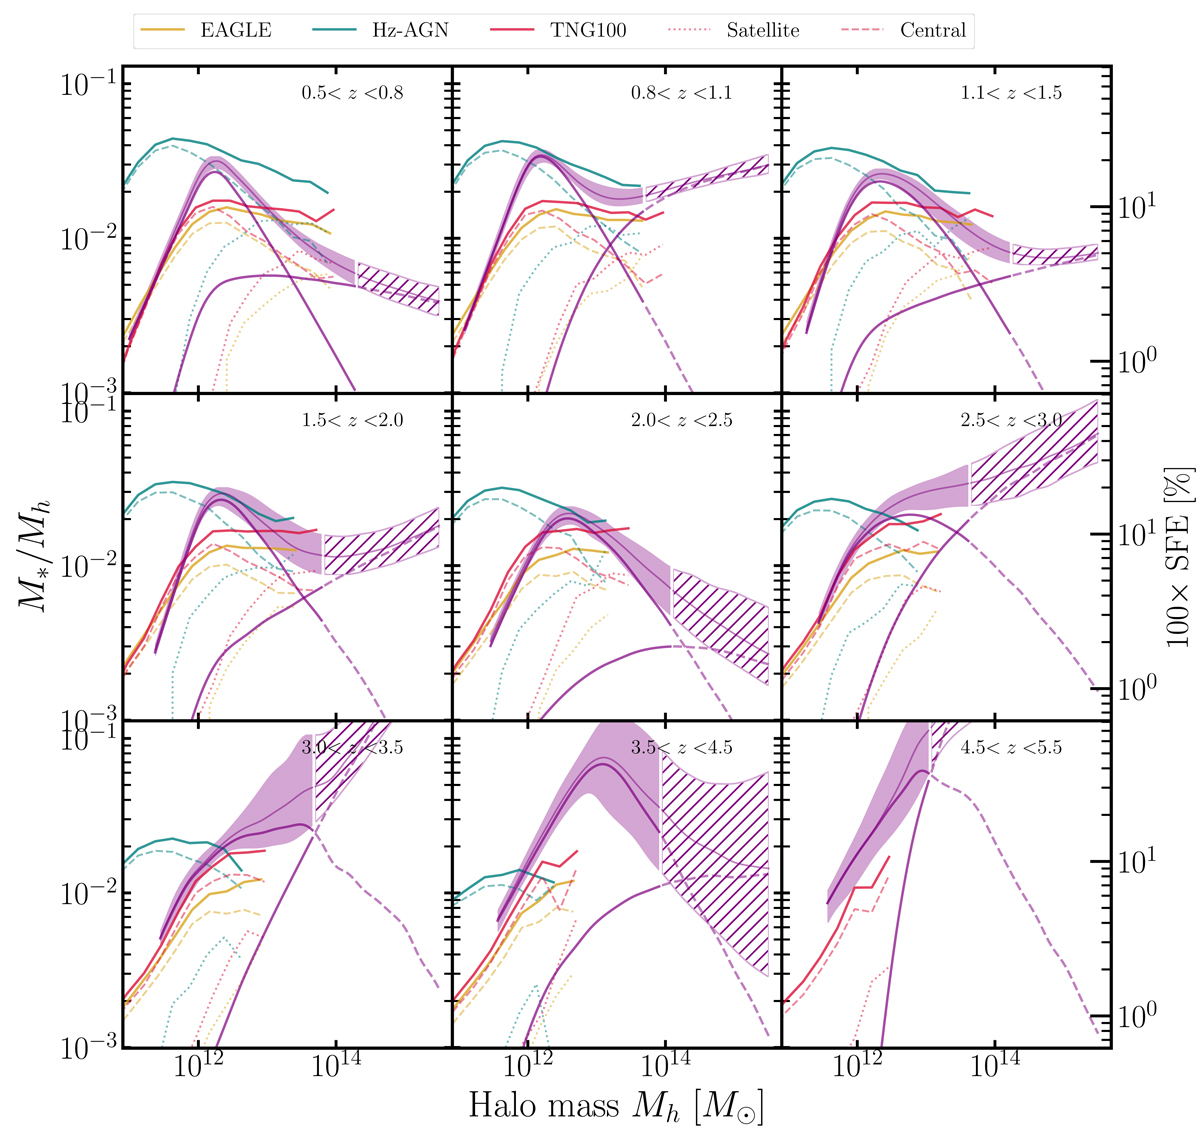
Fig. 12.
Download original image
Total M*/Mh in the different redshift bins compared to hydrodynamical simulations. The purple lines show our inferred central and satellite contribution to the total SHMR with the shaded region showing a 1σ confidence interval of the sum of the two. The break in solid purple lines and shaded regions indicate the highest stellar mass probed in our analysis, which we take to be the highest mass bin in the SMF. The dashed purple lines and hatched region is an extrapolation at higher masses. The comparison includes total M*/Mh found in the hydrodynamical simulations HORIZON-AGN in teal, TNG100 in red and EAGLE in dark yellow. The dashed and dotted lines for the simulations indicate the central and satellite contributions, respectively.
Current usage metrics show cumulative count of Article Views (full-text article views including HTML views, PDF and ePub downloads, according to the available data) and Abstracts Views on Vision4Press platform.
Data correspond to usage on the plateform after 2015. The current usage metrics is available 48-96 hours after online publication and is updated daily on week days.
Initial download of the metrics may take a while.